DiNapoli DMA Table
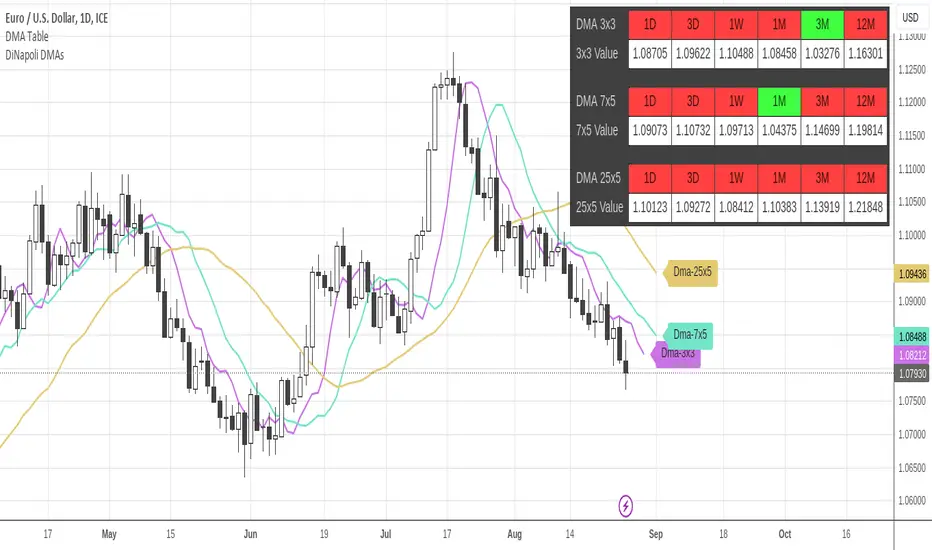
Only Higher Timeframes states do appear in the table. Lower Timeframes are grayed out, due to inability to get reliable results for such behaviour in current Tradingview environment.
The position of the table can be customized through the input panel.
Note: This indicator is demanding in terms of resources, and it might take some seconds to fully populate the table.
- Timeframes being displayed in the table are open to be selected.
- By default only 5 timeframes get activated: 1H, 4H, 1D, 1W and 1M
- Lower and deactivated timeframes don't appear in the table. That makes contributes to a cleaner chart space.
- Added the ability to monitor yearly (12M) timeframe.
- Timeframes display can be rendered in Ascending or Descending sorting.
僅限邀請腳本
Only users approved by the author can access this script. You'll need to request and get permission to use it. This is typically granted after payment. For more details, follow the author's instructions below or contact gliderfund directly.
TradingView does NOT recommend paying for or using a script unless you fully trust its author and understand how it works. You may also find free, open-source alternatives in our community scripts.
作者的說明
免責聲明
僅限邀請腳本
Only users approved by the author can access this script. You'll need to request and get permission to use it. This is typically granted after payment. For more details, follow the author's instructions below or contact gliderfund directly.
TradingView does NOT recommend paying for or using a script unless you fully trust its author and understand how it works. You may also find free, open-source alternatives in our community scripts.