INVITE-ONLY SCRIPT
CM EMA Crossover Price Probabilities custom
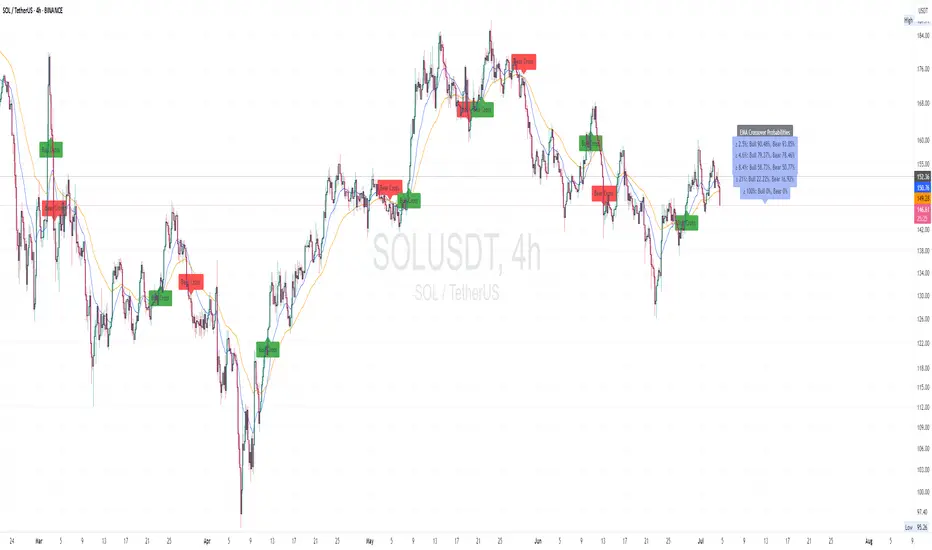
CM EMA Crossover Price Probabilities
This indicator combines Exponential Moving Average (EMA) crossovers with swing high/low detection to calculate and display the historical probability of price movements exceeding user-defined percentage thresholds. Unlike standard EMA crossover indicators, it quantifies the likelihood of specific price changes following bullish (fast EMA crossing above slow EMA) or bearish (fast EMA crossing below slow EMA) crossovers, providing traders with data-driven insights into potential price behavior.
How It Works:EMA Crossovers: Detects when the fast EMA crosses above (bullish) or below (bearish) the slow EMA, marking these events with chart labels.
Price Change Measurement: Measures the percentage price change from the crossover point to the next swing high (for bullish crossovers) or swing low (for bearish crossovers), using pivot point detection.
Probability Calculation: Analyses historical crossover data to compute the probability of price changes meeting or exceeding customizable percentage thresholds (e.g., 2.5%, 5%). Probabilities are displayed as labels on the last bar, showing both bullish and bearish outcomes.
Customization: Allows users to adjust EMA lengths, pivot lookback, historical data limit, and probability thresholds via inputs.
Inputs:Fast EMA Length (default: 20): Period for the fast EMA.
Slow EMA Length (default: 50): Period for the slow EMA.
Pivot Lookback (default: 15): Bars used to detect swing highs/lows.
Max Historical Crossovers (default: 100): Limits stored crossovers for performance.
Bin Thresholds (defaults: 2.5%, 4.6%, 8.4%, 21.0%, 100.0%): Five customizable percentage thresholds for probability calculations.
Usage:
Add the indicator to your chart and adjust inputs to match your trading style. Bullish and bearish crossover points are labeled on the chart, and probability labels appear in the top-right corner when sufficient data is available. Use these probabilities to assess the historical likelihood of price movements after EMA crossovers, aiding in trade planning or risk assessment.
Why It’s Useful:
By combining EMA crossovers with swing-based price change analysis, this indicator offers a unique perspective on market behaviour post-crossover. The customizable probability thresholds allow traders to focus on specific price movement targets, making it a versatile tool for studying trend strength and potential outcomes.
Notes:
Probabilities are based on historical data and do not predict future performance.
Set bin thresholds in ascending order for accurate probability calculations.
Designed for educational purposes to analyze EMA crossover patterns.
僅限邀請腳本
僅作者批准的使用者才能訪問此腳本。您需要申請並獲得使用許可,通常需在付款後才能取得。更多詳情,請依照作者以下的指示操作,或直接聯絡CryptoMainly。
TradingView不建議在未完全信任作者並了解其運作方式的情況下購買或使用腳本。您也可以在我們的社群腳本中找到免費的開源替代方案。
作者的說明
Please contact me by Direct Message for further information.
Thank you for your interest!!
免責聲明
這些資訊和出版物並非旨在提供,也不構成TradingView提供或認可的任何形式的財務、投資、交易或其他類型的建議或推薦。請閱讀使用條款以了解更多資訊。