OPEN-SOURCE SCRIPT
已更新 Modified RSI Multi-Time Frame (HM)
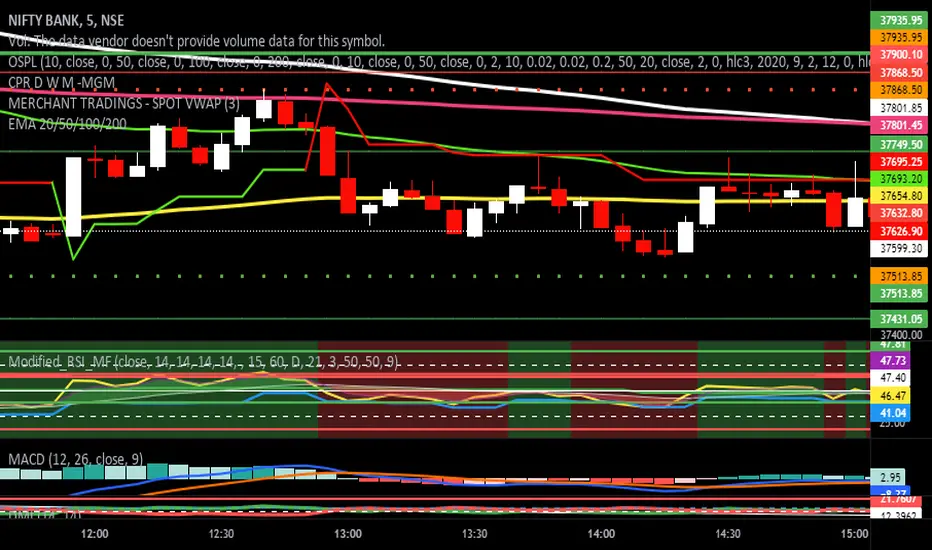
Effective RSI with Multi-Timeframe with Hilema - Milega(HM) concept (HM=WMA -EMA). RSI Script is included with WMA and EMA band for RSI1 and it works very simple
i) When the RSI band turns to Green its a Buy signal. Normally whenever Bearish strength weakens and move towards the Bullish area, the WMA and EMA cross each other and that tends to provide a possible trend change. A trade at crossover normally provides a very good trading oppertunity. One can combine with some other Price action if needed for double confirmation.
ii)When RSI band turns to RED its a Sell signal. As explained in the point 1 , its a vice-versa where a crossover of WMA and EMA is perfect entry to get a good swing trade. Once can combine this tool with Price action for double confirmation.
iii) Using the Multi timeframe user could able to find the trend at higher timeframe to take double confirm on the trend strength and take a perfect oppertunity to take the trade.
By default, script uses the RSI with length 14, WMA 21 and EMA 3 which perfectly working for Index in NSE. Please change as per your requirement.
Apart from the above band, RSI is not have the different levels like 20/ 40 /50/60/80
Multi-timeframes currently set as
RSI1 - Same as Chart
RSI2 - 15 Min
RSI3 - 60 Min
RSI4 - Daily
Script has enabled the option to change the values for these timeframes as per the user requirement.
These ranges can be interpreted and acts as a probable swing points based on the trend and momentum.
40-60 - Neutral Range or Sideways
20 - 60 Bearish range
40 - 70 - Bullish range
Below 20 -- Over Sold Zone
Above 80 - over Bought zone
Also, the crossovers of the WMA and EMA on the RSI gives a very good momentum towards that trend.
發行說明
- Added the BG color to the RSI開源腳本
秉持TradingView一貫精神,這個腳本的創作者將其設為開源,以便交易者檢視並驗證其功能。向作者致敬!您可以免費使用此腳本,但請注意,重新發佈代碼需遵守我們的社群規範。
免責聲明
這些資訊和出版物並非旨在提供,也不構成TradingView提供或認可的任何形式的財務、投資、交易或其他類型的建議或推薦。請閱讀使用條款以了解更多資訊。
開源腳本
秉持TradingView一貫精神,這個腳本的創作者將其設為開源,以便交易者檢視並驗證其功能。向作者致敬!您可以免費使用此腳本,但請注意,重新發佈代碼需遵守我們的社群規範。
免責聲明
這些資訊和出版物並非旨在提供,也不構成TradingView提供或認可的任何形式的財務、投資、交易或其他類型的建議或推薦。請閱讀使用條款以了解更多資訊。