OPEN-SOURCE SCRIPT
Indicator: MFI or RSI enclosed by Bollinger Bands
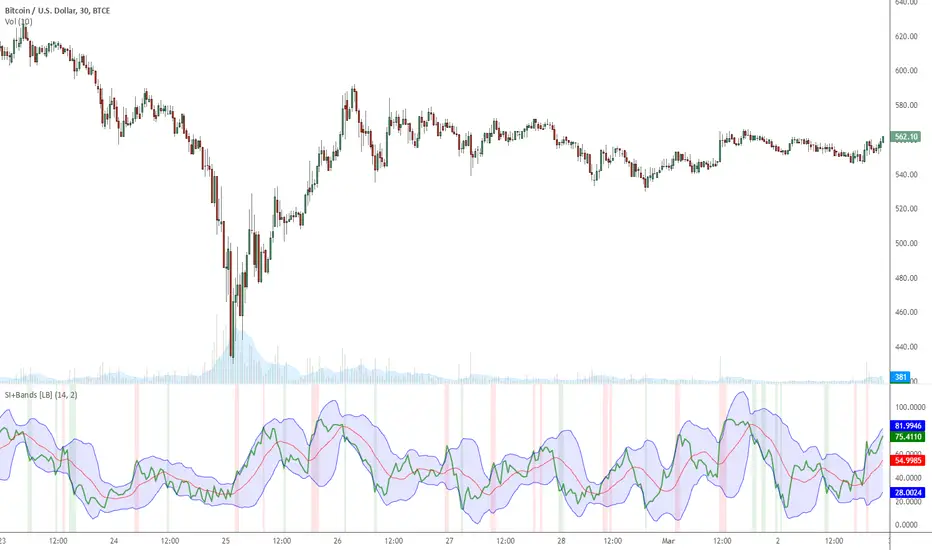
Indicator allows choosing either MFI or RSI and draws a BB over it to identify oversold / overbought conditions.
Oversold/Overbought breaches are highlighted using different colors for easy identification. Has helped me a lot during sudden pumps to identify the tops, hope you find a use for this.
Oversold/Overbought breaches are highlighted using different colors for easy identification. Has helped me a lot during sudden pumps to identify the tops, hope you find a use for this.
開源腳本
秉持TradingView一貫精神,這個腳本的創作者將其設為開源,以便交易者檢視並驗證其功能。向作者致敬!您可以免費使用此腳本,但請注意,重新發佈代碼需遵守我們的社群規範。
List of my free indicators: bit.ly/1LQaPK8
List of my indicators at Appstore: blog.tradingview.com/?p=970
List of my indicators at Appstore: blog.tradingview.com/?p=970
免責聲明
這些資訊和出版物並非旨在提供,也不構成TradingView提供或認可的任何形式的財務、投資、交易或其他類型的建議或推薦。請閱讀使用條款以了解更多資訊。