OPEN-SOURCE SCRIPT
已更新 MFI Divergence
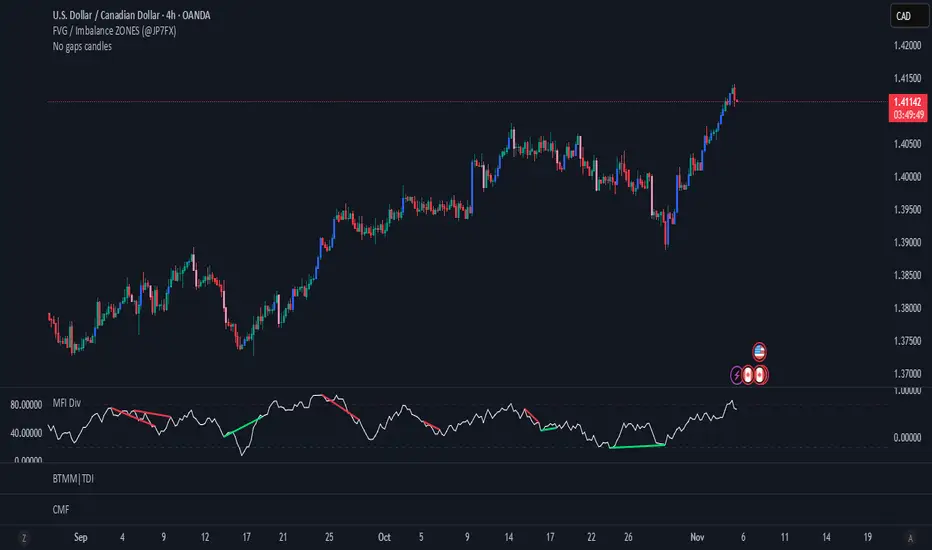
This indicator automatically detects bullish and bearish divergences between price and the Money Flow Index (MFI).
It’s designed for traders who use momentum divergence to anticipate potential trend reversals or continuation traps, and has been optimized to avoid false positives while still catching subtle setups on lower timeframes like 15m.
How It Works
Calculates the Money Flow Index (MFI) using price and volume.
Identifies swing highs and lows on the MFI using adaptive pivot logic.
Compares MFI pivots against corresponding price highs/lows:
Bullish Divergence: Price makes a lower low while MFI makes a higher low.
Bearish Divergence: Price makes a higher high while MFI makes a lower high.
Displays divergences as green (bullish) or red (bearish) lines on the MFI chart.
發行說明
add center line開源腳本
本著TradingView的真正精神,此腳本的創建者將其開源,以便交易者可以查看和驗證其功能。向作者致敬!雖然您可以免費使用它,但請記住,重新發佈程式碼必須遵守我們的網站規則。
免責聲明
這些資訊和出版物並不意味著也不構成TradingView提供或認可的金融、投資、交易或其他類型的意見或建議。請在使用條款閱讀更多資訊。
開源腳本
本著TradingView的真正精神,此腳本的創建者將其開源,以便交易者可以查看和驗證其功能。向作者致敬!雖然您可以免費使用它,但請記住,重新發佈程式碼必須遵守我們的網站規則。
免責聲明
這些資訊和出版物並不意味著也不構成TradingView提供或認可的金融、投資、交易或其他類型的意見或建議。請在使用條款閱讀更多資訊。