OPEN-SOURCE SCRIPT
RSI + BTC Short & Long RSIs
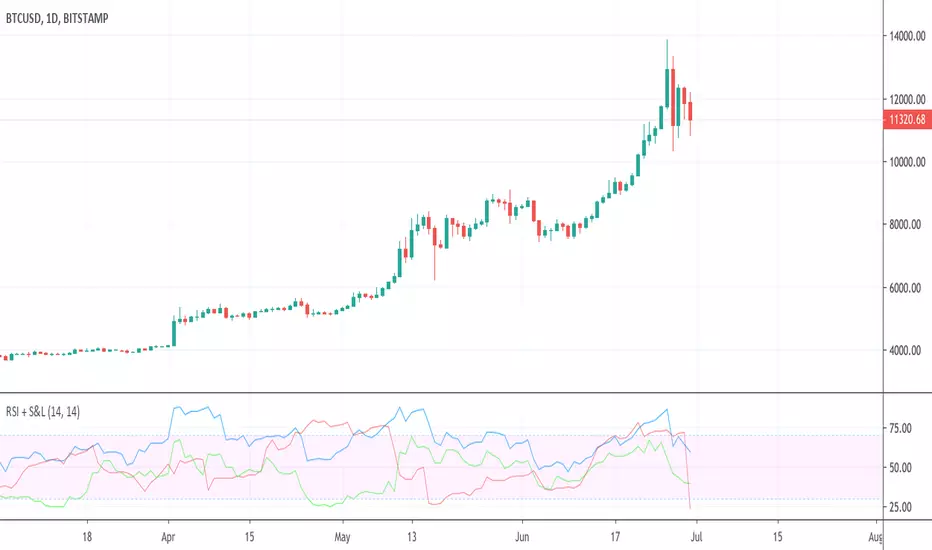
Plots the RSI for the current chart (same as the built-in RSI indicator) and adds the RSI values for the Shorts and Longs (S&L) from Bitmex. The main reason I've used the RSI value is to have it on the same scale as the price chart's RSI. The general trend of the S&L is preserved.
開源腳本
秉持TradingView一貫精神,這個腳本的創作者將其設為開源,以便交易者檢視並驗證其功能。向作者致敬!您可以免費使用此腳本,但請注意,重新發佈代碼需遵守我們的社群規範。
免責聲明
這些資訊和出版物並非旨在提供,也不構成TradingView提供或認可的任何形式的財務、投資、交易或其他類型的建議或推薦。請閱讀使用條款以了解更多資訊。
免責聲明
這些資訊和出版物並非旨在提供,也不構成TradingView提供或認可的任何形式的財務、投資、交易或其他類型的建議或推薦。請閱讀使用條款以了解更多資訊。