OPEN-SOURCE SCRIPT
已更新 Equilibrium
╭━━━╮╱╱╱╱╱╱╭╮╱╭╮
┃╭━━╯╱╱╱╱╱╱┃┃╱┃┃
┃╰━━┳━━┳╮╭┳┫┃╭┫╰━┳━┳┳╮╭┳╮╭╮
┃╭━━┫╭╮┃┃┃┣┫┃┣┫╭╮┃╭╋┫┃┃┃╰╯┃
┃╰━━┫╰╯┃╰╯┃┃╰┫┃╰╯┃┃┃┃╰╯┃┃┃┃
╰━━━┻━╮┣━━┻┻━┻┻━━┻╯╰┻━━┻┻┻╯
╱╱╱╱╱╱┃┃
╱╱╱╱╱╱╰╯
Overview
Equilibrium is a tool designed to measure the buying & selling pressure in the market. It is depicted as a “pressure gauge” that automatically adjusts as new candles are formed, providing a real-time indication of who's on top right now, buyers or sellers?
Background
Supply & demand is considered to be the main driving force of our modern economies, where the interaction between the two parties(sellers & buyers) leads to the determination of the fair price for a given product. Stock markets are no exception, they operate very much based around the idea of supply & demand.
In simple terms, supply refers to the availability of a product, and demand is the willingness of consumers to buy that product at a given price. It is obvious that different vendors may sell the same product at slightly different prices, and similarly, different customers may choose to buy the same product from different vendors at varying prices. The idea is that the price is allowed to fluctuate from time to time, but in a free & fair market, the price will eventually settle down to a value that makes both the parties happy. Such a state is known as the “Price-Equilibrium”, and this process is also referred to as the market mechanism.
This is the basic assumption around which this tool is based, the market is always trying to move towards a state of equilibrium.
Calculations
This tool takes a simplistic approach to estimate the degree of imbalance between buyers & sellers, here’s a brief summary of how the pressure is calculated:
- We compute the total lengths of red & green candles for a given period, i.e. price range multiplied by the volume for that candle.
- Then the distribution of each type of candle is calculated.
- Assuming more red candles denote more selling pressure, and green candles denote buying pressure, the gauge is populated cell by cell.
- As the pressure on one side increases, the intensity of the cell color also increases, signifying the extent to which one side is dominating.
How to use it
- The indicator is designed as a pressure gauge that moves up(vertical alignment) or to the right(horizontal alignment) as the buying pressure increases, and moves down or to the left as the selling pressure increases. How it is to be used & applied, that completely depends on your trading methodology. But, the general idea is that we expect the market to be in a state of equilibrium, and if that is not the case the tool will highlight that, and this is also where the opportunity lies to find suitable trades.
- Just by having an idea about who’s dominating the market currently, a trader can also pick sides wisely. Remember, the market is always striving to come back a state of equilibrium, and a slight imbalance can indicate the current trend, and more importantly, who’s more likely to make the next move.
User Settings
The tool offers some minimal configurations for the end user:
- You can choose to display the actual percentage value in the gauge(Show Text).
- You can adjust colors that denote buyers & sellers.
- You can change the layout of gauge, default is vertical(right side of the screen).
- Last, and most important, you can adjust the number of candles to traverse for calculating the pressure. Default is 50, can go upto 1000.
發行說明
Minor Release- No functional changes
- Replaced variables called "type", as it is an internal keyword
發行說明
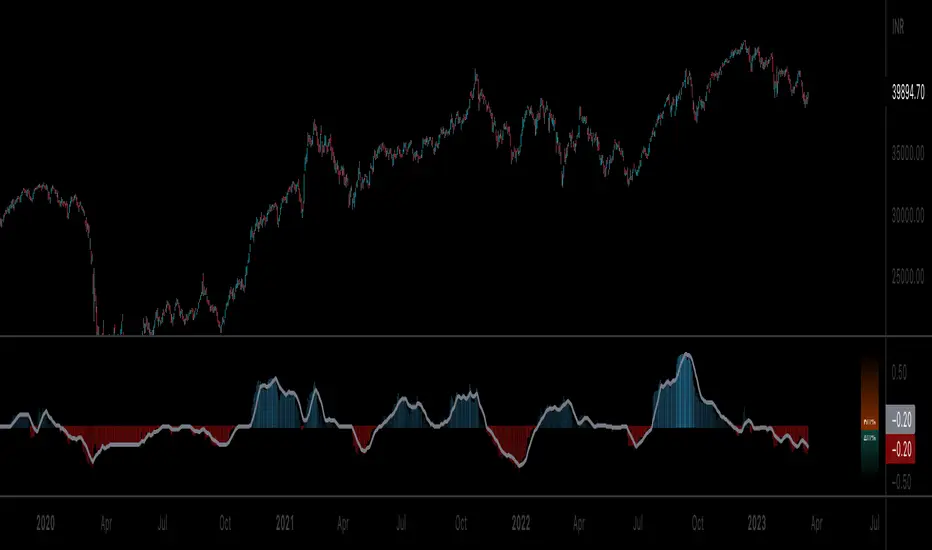
Major ReleaseUpdates:
- Indicator will now be shown in a separate pane, instead of the main chart window
- Pressure Gauge has been turned into an oscillator that ranges between -1 & +1
- Values leaning towards -1 indicate selling pressure(total length of red candles multiplied by volume), and positive values indicate buying pressure
- Plots have been smoothened using moving averages, users can modify the length of MAs
- Short MA is what is shown as the default oscillator, users can overlay long MA(hidden by default)
- Older gauge will still be available, users will have to toggle it(hidden by default)
- Minor adjustments to color scheme & user input
發行說明
Minor ReleaseUpdates:
- Adjusted color transparency
- Updated plot style
發行說明
Minor ReleaseUpdates:
- Added separate look-back period for the oscillator
- Defaults to 30, ranges between 5 & 100
發行說明
Minor ReleaseUpdates:
- Adjusted the cell height & width
發行說明
Minor ReleaseUpdates:
- Dynamic cell width
開源腳本
本著TradingView的真正精神,此腳本的創建者將其開源,以便交易者可以查看和驗證其功能。向作者致敬!雖然您可以免費使用它,但請記住,重新發佈程式碼必須遵守我們的網站規則。
免責聲明
這些資訊和出版物並不意味著也不構成TradingView提供或認可的金融、投資、交易或其他類型的意見或建議。請在使用條款閱讀更多資訊。
開源腳本
本著TradingView的真正精神,此腳本的創建者將其開源,以便交易者可以查看和驗證其功能。向作者致敬!雖然您可以免費使用它,但請記住,重新發佈程式碼必須遵守我們的網站規則。
免責聲明
這些資訊和出版物並不意味著也不構成TradingView提供或認可的金融、投資、交易或其他類型的意見或建議。請在使用條款閱讀更多資訊。