INVITE-ONLY SCRIPT
已更新 Sniper BB Scope 9x v2.0
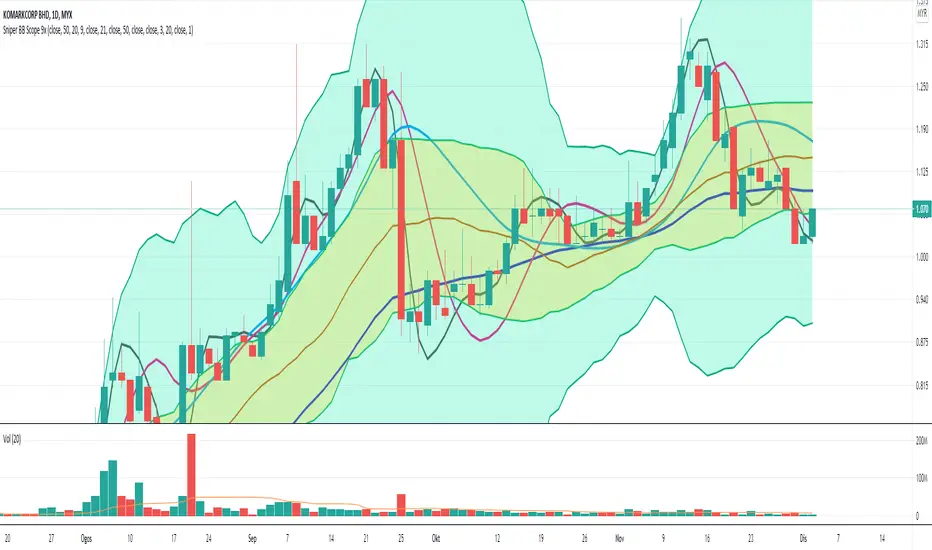
This indicator is combination of two indicators;-
1- BB
2- HMA
Component of BB and the improvement
- combining two BB with different standard deviation that will help trader to identify the range of the price movement. The BB seperate by different colors background so that will help trader to easyly find the price trend.
1. Outer BB - dark green background with dark green line boundaries
- bb breakout with volume if reach the upper bb will have potential to surfing upper BB. But please double confirm with others indi for the momentum. If reach peak, then possible to going back to Upper Inner BB or mid BB.
2. Inner BB - yellow background with light green line boundaries
- can act as nearest support if price going retrace from upper BB. Sometime, the price retrace a bit and making support here before push to higher price.
3. Black line
- cross up candle can buy
- cross down candle can sell
4. Red line
- cross up candle can buy
- cross down candle can sell
5. Blue line act as strong support and resistant for the long term position
- If candle trading below blue line, the blue line will act as resistant.
- If candle trading above blue line, the blue line will act as support.
The signal indication
Strong buy signal
When both black and red line cross up the blue line.
Strong sell signal
When both black and red line line cross down the blue line.
發行說明
update - revised more accurate multiple hma calculation
發行說明
Adding lag hma 50僅限邀請腳本
僅作者批准的使用者才能訪問此腳本。您需要申請並獲得使用許可,通常需在付款後才能取得。更多詳情,請依照作者以下的指示操作,或直接聯絡bids_sniper。
TradingView不建議在未完全信任作者並了解其運作方式的情況下購買或使用腳本。您也可以在我們的社群腳本中找到免費的開源替代方案。
作者的說明
免責聲明
這些資訊和出版物並非旨在提供,也不構成TradingView提供或認可的任何形式的財務、投資、交易或其他類型的建議或推薦。請閱讀使用條款以了解更多資訊。
僅限邀請腳本
僅作者批准的使用者才能訪問此腳本。您需要申請並獲得使用許可,通常需在付款後才能取得。更多詳情,請依照作者以下的指示操作,或直接聯絡bids_sniper。
TradingView不建議在未完全信任作者並了解其運作方式的情況下購買或使用腳本。您也可以在我們的社群腳本中找到免費的開源替代方案。
作者的說明
免責聲明
這些資訊和出版物並非旨在提供,也不構成TradingView提供或認可的任何形式的財務、投資、交易或其他類型的建議或推薦。請閱讀使用條款以了解更多資訊。