INVITE-ONLY SCRIPT
已更新 [Beta] Volume Cumulative Delta in Interval
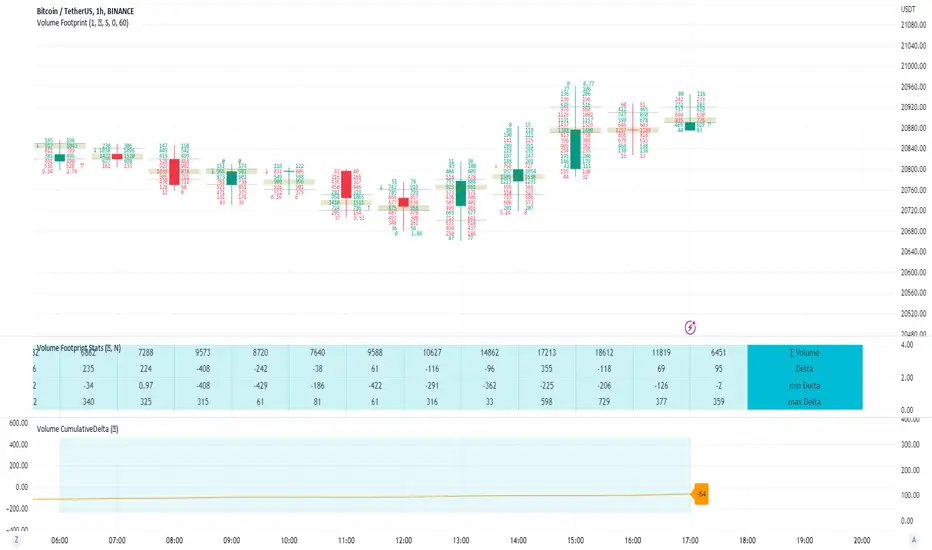
This is a script extending the functionality of "Order Footprint". It is showing Cumulative Delta (Difference betwen Volume Up and Volume Down) in current interval.
Script is collecting volume footprint with the precision picked by user. We recomend to use highest possible precision.
Unfortunatelly Trading View has many limitations.
If after adding script nothing is visible with error: "'The study references too many candles in history'" you need to use lower precision - It can be changed in script settings.
This script is a part of a toolkit called "Volume Footprint", containing few more tools:
Volume Footprint - Volume Footprint chart.
Volume Footprint Statistics - Script showing table with basic statistics about Up and Down Volume inside the candle.
Volume Delta - Showing candles of imbalance between Up and Down Volume changes inside candles.
Volume Delta In Candle- Chart showing history of imbalance between Up and Down Volume changes inside current candle.
Volume Cumulative Delta - Showing candles of imbalance changes between UP and Down Volume cumulated in trading time equal to interval.
Volume Cumulative Delta in Interval- Chart showing history of imbalance changes between UP and Down Volume cumulated in trading time equal to interval.
This script can be used by any user. You do not need to have PRO or PREMIUM account to use it.
Script with limited access, contact author to get authorization
User Interface:
Script is drawing a line of values demonstrating how Cumultive Delta was changing during last interval.
Current value of cumulative Delta is shown in the label on the right side of the chart.
Script settings:
Data precision - One of 6 levels of data precision: ▉▇▆▅▃▁, where ▉ means the highest precision and ▁ the lowest available precision. On 15 minute chart highest precision should be available, but on 1D it will probably hit TradingView limitations and script will not be even launched by the platform with error: "'The study references too many candles in history'". The general recommendation is to use the highest available precision for a given instrument and interval.
Background - Drawing background below the chart.
Line color - Color of data line over the chart.
Simplify drawing - Visualization option that skips some shape detail in exchange for a longer history of value.
Troubleshooting:
In case of any problems, send error details to the author of the script.
Known issues:
"The study references too many candles in history" - Change "Data precision" settings to some lower value.
發行說明
Package of improvements 發行說明
Package of improvements:- Addition precision levels dedicated to 1W and 1M charts.
- Verification with main script feature
- Improved error reporting
僅限邀請腳本
只有經作者批准的使用者才能訪問此腳本。您需要申請並獲得使用權限。該權限通常在付款後授予。如欲了解更多詳情,請依照以下作者的說明操作,或直接聯絡Investor_R。
請注意,此私人、僅限邀請的腳本尚未經過腳本管理員審核,其是否符合社群規範尚無定論。 除非您完全信任其作者並了解腳本的工作原理,否則TradingView不建議您付費或使用腳本。您也可以在我們的社群腳本中找到免費的開源替代方案。
作者的說明
To get access or report problem write on toolkit4trading@proton.me
To get access or report problem write on toolkit4trading@proton.me
More details on Website and Youtube.
More details on Website and Youtube.
免責聲明
這些資訊和出版物並不意味著也不構成TradingView提供或認可的金融、投資、交易或其他類型的意見或建議。請在使用條款閱讀更多資訊。