BK AK-SILENCER🚨 Introducing BK AK-SILENCER — Volume Footprint Warfare, Right on the Price Bars 🚨
This isn’t a traditional indicator.
This is a tactical weapon — engineered to expose institutional behavior directly in the bar data, using volume logic, CVD divergence, and spike detection to pinpoint who’s really in control of the tape.
No panels. No clutter.
Just silent execution — built directly into price itself.
🔥 Why "SILENCER"?
Because real power moves in silence.
Institutions don’t chase — they build positions quietly, in size, beneath the surface.
BK AK-SILENCER gives you a real-time edge by visually revealing their footprints through color-coded bar behavior, divergence signals, and volume spike alerts — all directly on your chart.
🔹 “AK” honors my mentor A.K., whose training forged my trading discipline.
🔹 “SILENCER” represents the institutional mindset — high impact, low visibility. This tool lets you trade like them: without noise, without hesitation, with deadly clarity.
🧠 What Is BK AK-SILENCER?
A bar-level institutional detection tool, purpose-built to:
✅ Color-code bars based on volume aggression and close-location inside range
✅ Detect real-time bullish and bearish divergences between price and volume delta
✅ Tag volume spikes with a $ symbol to expose potential traps or silent position builds
✅ Overlay VWAP for real-time mean-reversion biasing
No extra windows.
No indicators talking over each other.
Just pure volume-logic weaponry embedded into price.
⚙️ What This Weapon Deploys
🔸 Bar Coloring Logic (Volume Footprint)
🟢 Power Buy = Strong close near highs on elevated volume
🟩 Accumulation = Weak close but still heavy volume
🔴 Power Sell = Strong close near lows on heavy selling
🟥 Distribution / Weakness = Low close without commitment
❗ Extreme Volume Spikes marked with $ — using standard deviation to highlight institutional bursts
🔸 CVD Divergence Detection
→ Tracks cumulative volume delta and compares it to price pivot behavior
Bullish Divergence = Price makes lower lows, CVD makes higher lows → hidden accumulation
Bearish Divergence = Price makes higher highs, CVD makes lower highs → hidden distribution
All plotted directly on bars with triangle markers.
🔸 VWAP Overlay (Optional)
→ Anchored VWAP gives immediate context for intraday bias — above VWAP = demand, below = supply
🎯 How to Use BK AK-SILENCER
🔹 Silent Reversal Detection
Bullish divergence + Power Buy bar + VWAP reclaim = sniper entry
Bearish divergence + Power Sell bar + VWAP rejection = trap confirmation
🔹 Volume-Based Entry Triggers
Look for Power Buy + $ spike after a pullback → watch for quiet reversal
Accumulation colors clustering? Institutions are likely loading silently
🔹 Institutional Trap Warnings
$ spike + red distribution bar at highs = time to exit or flip
Weakness bar below VWAP? Don’t chase the long.
🛡️ Why It Matters
✅ Clean — it integrates into price action, no separate panels
✅ Silent — tracks institutions who build without alerts or indicators
✅ Tactical — no fluff, no lag, just real-time behavior recognition
This tool is ideal for:
🔸 Scalpers reading bar-by-bar
🔸 Intraday swing traders using VWAP and structure
🔸 Professionals who need volume behavior decoded in real-time
🔸 Anyone who wants signal without clutter
🙏 Final Thoughts
This tool isn’t just about trading — it’s about tactical awareness.
🔹 Dedicated to my mentor A.K., whose wisdom runs deep in every logic tree.
🔹 Above all, I give thanks to Gd, the source of clarity, courage, and conviction.
Without Him, even the sharpest system is blind.
With Him, we execute with structure, purpose, and divine alignment.
⚡ No noise. No clutter. No delay. Just raw, silent execution.
🔥 BK AK-SILENCER — Bar-Level Volume Footprint Precision 🔥
Gd bless every step you take in this market.
Trade with clarity, move with intention. 🙏
Volumedelta

BK AK-SILENCER (P8N)🚨Introducing BK AK-SILENCER (P8N) — Institutional Order Flow Tracking for Silent Precision🚨
After months of meticulous tuning and refinement, I'm proud to unleash the next weapon in my trading arsenal—BK AK-SILENCER (P8N).
🔥 Why "AK-SILENCER"? The True Meaning
Institutions don’t announce their moves—they move silently, hidden beneath the noise. The SILENCER is built specifically to detect and track these stealth institutional maneuvers, giving you the power to hunt quietly, execute decisively, and strike precisely before the market catches on.
🔹 "AK" continues the legacy, honoring my mentor, A.K., whose teachings on discipline, precision, and clarity form the cornerstone of my trading.
🔹 "SILENCER" symbolizes the stealth aspect of institutional trading—quiet but deadly moves. This indicator equips you to silently track, expose, and capitalize on their hidden footprints.
🧠 What Exactly is BK AK-SILENCER (P8N)?
It's a next-generation Cumulative Volume Delta (CVD) tool crafted specifically for traders who hunt institutional order flow, combining adaptive volatility bands, enhanced momentum gradients, and precise divergence detection into a single deadly-accurate weapon.
Built for silent execution—tracking moves quietly and trading with lethal precision.
⚙️ Core Weapon Systems
✅ Institutional CVD Engine
→ Dynamically measures hidden volume shifts (buying/selling pressure) to reveal institutional footprints that price alone won't show.
✅ Adaptive AK-9 Bollinger Bands
→ Bollinger Bands placed around a custom CVD signal line, pinpointing exactly when institutional accumulation or distribution reaches critical extremes.
✅ Gradient Momentum Intelligence
→ Color-coded momentum gradients reveal the strength, speed, and silent intent behind institutional order flow:
🟢 Strong Bullish (aggressive buying)
🟡 Moderate Bullish (steady accumulation)
🔵 Neutral (balance)
🟠 Moderate Bearish (quiet distribution)
🔴 Strong Bearish (aggressive selling)
✅ Silent Divergence Detection
→ Instantly spots divergence between price and hidden volume—your earliest indication that institutions are stealthily reversing direction.
✅ Background Flash Alerts
→ Visually highlights institutional extremes through subtle background flashes, alerting you quietly yet powerfully when market-moving players make their silent moves.
✅ Structural & Institutional Clarity
→ Optional structural pivots, standard deviation bands, volume profile anchors, and session lines clearly identify the exact levels institutions defend or attack silently.
🛡️ Why BK AK-SILENCER (P8N) is Your Edge
🔹 Tracks Institutional Footprints—Silently identifies hidden volume signals of institutional intentions before they’re obvious.
🔹 Precision Execution—Cuts through noise, allowing you to execute silently, confidently, and precisely.
🔹 Perfect for Traders Using:
Elliott Wave
Gann Methods (Angles, Squares)
Fibonacci Time & Price
Harmonic Patterns
Market Profile & Order Flow Analysis
🎯 How to Use BK AK-SILENCER (P8N)
🔸 Institutional Reversal Hunting (Stealth Mode)
Bearish divergence + CVD breaking below lower BB → stealth short signal.
Bullish divergence + CVD breaking above upper BB → quiet, early long entry.
🔸 Momentum Confirmation (Silent Strength)
Strong bullish gradient + CVD above upper BB → follow institutional buying quietly.
Strong bearish gradient + CVD below lower BB → confidently short institutional selling.
🔸 Noise Filtering (Patience & Precision)
Neutral gradient (blue) → remain quiet, wait patiently to strike precisely when institutional activity resumes.
🔸 Structural Precision (Institutional Levels)
Optional StdDev, POC, Value Areas, Session Anchors clearly identify exact institutional defense/offense zones.
🙏 Final Thoughts
Institutions move in silence, leaving subtle footprints. BK AK-SILENCER (P8N) is your specialized weapon for tracking and hunting their quiet, decisive actions before the market reacts.
🔹 Dedicated in deep gratitude to my mentor, A.K.—whose silent wisdom shapes every line of code.
🔹 Engineered for the disciplined, quiet hunter who knows when to wait patiently and when to strike decisively.
Above all, honor and gratitude to Gd—the ultimate source of wisdom, clarity, and disciplined execution. Without Him, markets are chaos. With Him, we move silently, purposefully, and precisely.
⚡ Stay Quiet. Stay Precise. Hunt Silently.
🔥 BK AK-SILENCER (P8N) — Track the Silent Moves. Strike with Precision. 🔥
May Gd bless every silent step you take. 🙏

TRAPPER Volume Trigger + SMAs + Buy/Sell SplitThe TRAPPER TRIGGER is a precision-based volume spike indicator designed for intraday traders, scalpers, and swing traders who rely on key volume activity to anticipate sharp market movements. It operates on volume delta logic, detecting disproportionate buying or selling activity that signifies potential market reversals or breakouts.
How It Works:
Volume Spike Logic (Delta-Based)
The script calculates a dynamic volume threshold using a moving average of historical volume data.
It identifies a delta spike by comparing current volume against this threshold—when volume exceeds it significantly, it suggests abnormal activity.
If the candle closes higher than it opens (bullish), the script registers it as a Buy Spike ⚖️.
If the candle closes lower than it opens (bearish), it marks a Sell Spike 🏁.
These are not based on the candle’s body size but the volume differential (delta) between buy/sell pressure inferred from candle direction.
Trigger Labels
Only the most recent buy/sell spike is labeled for clarity, avoiding clutter.
Labels are color-coded to match the candle body (e.g., bright green for bullish, magenta for bearish).
Label style: ⚖️ for Buy Spikes, 🏁 for Sell Spikes.
SMA Suite (Fully Customizable):
Six SMAs: 5 (yellow), 10 (blue), 20 (green), 50 (orange), 100 (red), 200 (white).
Each can be toggled and customized in the script settings for visibility and styling.
Key Benefits
Clean, minimalistic charting — focuses only on high-probability events.
Provides delta-driven insights without requiring access to full L2 order book data.
Works across any timeframe — logic recalculates and resets zones per timeframe switch.
Designed for sniper-style entries—ideal for traders who prefer minimal noise and maximum signal clarity.
Easily extendable with SR zones, AVWAP, liquidity levels, or alerts if desired in future updates.
Who It’s For
Scalpers and intraday traders looking for clean triggers.
Swing traders wanting confirmation of institutional moves.
Volume profile enthusiasts who need a trigger alert system.
Developers who want a base volume framework to build more advanced tools on.
Disclaimer
This script is provided as-is and is intended for educational and informational purposes only. It does not constitute financial advice, investment recommendations, or a solicitation to buy or sell any security or asset.
All trading involves risk. Users should perform their own due diligence and consult with a qualified financial advisor before making any trading decisions. The author of this script assumes no liability for any losses or damages arising from the use or reliance on this tool.
By using this script, you acknowledge and agree that you are solely responsible for your own trading decisions and outcomes.

OI Bahavior MapThis indicator visualizes Open Interest (OI) changes for Binance Futures and highlights the behavior of market participants — whether takers or makers are opening or closing positions.
📊 Supported display modes:
• Taker or Maker
• Longs or Shorts
• Cumulative or Per-Bar
• Displayed in USD or Coins
💡 Each candle color reflects the dominant trade direction (delta):
🟢 Green = Aggressive buying (Delta Buy)
🔴 Red = Aggressive selling (Delta Sell)
OI direction (↑/↓) determines whether positions are being opened or closed.
🛠️ Optional metrics:
• Moving average of OI (SMA, EMA, WMA, VWMA, LSMA)
• Volatility channels (Bollinger Bands or Extremums)
⚙️ How it works:
• Fetches OI data from the SYMBOL_OI ticker (e.g., BTCUSDT_OI)
• Compares current OI with the previous bar
• Uses signed volume delta (close - open) to infer intent
• Classifies bar as open/close, long/short, taker/maker
• Displays the net effect as a colored candle on a secondary chart
🤔 How to interpret Taker and Maker?
• Taker: The aggressive participant who removes liquidity (initiates the trade)
• Maker: The passive participant who provides liquidity (places resting orders)
You can choose to display the same event from either the Taker or Maker perspective — the chart will look the same, but the interpretation changes.
🧠 Core Logic Mapping
```
🟢 Green: Taker Longs (Buy, OI↑) | Maker Shorts (Buy, OI↓)
🔴 Red: Taker Shorts (Sell, OI↑) | Maker Longs (Sell, OI↓)
```
⚠️ Limitations:
• Works only for Binance Futures
• Requires existence of SYMBOL_OI ticker on TradingView
• Represents approximate intent based on OI + volume behavior
💬 Open Source
The script is open for the community. Suggestions and feedback are welcome in the comments!
__________________________________________________________________________________
Этот индикатор визуализирует изменения открытого интереса (OI) для Binance Futures и показывает поведение участников рынка — открывают или закрывают позиции тейкеры или мейкеры.
📊 Доступные режимы отображения:
• Taker или Maker
• Longs или Shorts
• Кумулятивный или по бару
• В USD или в монетах
💡 Каждый цвет свечи отражает преобладающее направление сделок (дельта):
🟢 Зеленый = Агрессивные покупки (Delta Buy)
🔴 Красный = Агрессивные продажи (Delta Sell)
Направление OI (↑/↓) показывает, открываются или закрываются позиции.
🛠️ Дополнительные метрики:
• Скользящая средняя OI (SMA, EMA, WMA, VWMA, LSMA)
• Волатильностные каналы (Bollinger Bands или экстремумы)
⚙️ Как работает:
• Получает данные OI из тикера SYMBOL_OI (например, BTCUSDT_OI)
• Сравнивает текущий OI с предыдущим баром
• Использует направленную дельту объема (close - open) для определения намерения
• Классифицирует бар как открытие/закрытие, лонг/шорт, тейкер/мейкер
• Отображает итог в виде цветной свечи на дополнительном графике
🤔 Как интерпретировать Taker и Maker?
• Taker: Агрессивный участник, который изымает ликвидность (инициирует сделку)
• Maker: Пассивный участник, который создает ликвидность (выставляет лимитные заявки)
Вы можете выбрать отображение события с позиции тейкера или мейкера — график будет одинаковым, но смысл меняется.
🧠 Схема логики
```
🟢 Зеленый: Taker Longs (Покупка, OI↑) | Maker Shorts (Покупка, OI↓)
🔴 Красный: Taker Shorts (Продажа, OI↑) | Maker Longs (Продажа, OI↓)
```
⚠️ Ограничения:
• Работает только для Binance Futures
• Требуется наличие тикера SYMBOL_OI на TradingView
• Показывает приблизительное намерение на основе OI и дельты объема
💬 Open Source
Скрипт открыт для сообщества. Предложения и обратная связь приветствуются в комментариях!

[IX] 15min ORB + Volume Trend DeltaIX 15-Minute ORB + Trend Volume Delta
A powerful intraday tool that combines Opening-Range Breakouts with a real-time volume delta tracker and adaptive trend logic—built for traders who want to stay on the right side of momentum and liquidity.
🔹 WHAT THIS INDICATOR DOES
• Automatically draws the Opening Range (ORB) for London (07:00–07:15 UTC) and New York (13:30–13:45 UTC) sessions.
• Once the ORB is set, it highlights the high and low levels throughout the session.
• Adds key previous levels: yesterday’s High, Low, Open and the most recent 4H High/Low.
• Includes a Trend MA with ±2× ATR(200) bands to define bullish/bearish market conditions.
• Tracks buy vs sell volume within the current trend regime and shows it live on your chart as a percentage delta.
🔹 HOW TO USE IT
Set your chart to 5-minute timeframe (or any intraday timeframe up to the selected ORB window).
When the session begins, the script automatically locks in the ORB zone.
Once the ORB is formed:
• If price breaks and holds above the ORB ➤ focus on longs.
• If price breaks and holds below the ORB ➤ focus on shorts.
Use the Trend Volume Delta as confirmation—strong buy delta supports longs, strong sell delta supports shorts.
Targets and support/resistance can be aligned with previous Daily / 4H levels.
🔹 TREND FILTER & VOLUME DELTA
• The adaptive trend MA uses CMO-based weighting, becoming more responsive during momentum shifts and more stable during chop.
• Trend regime is defined by price closing above or below the ±2× ATR bands.
• While inside a regime (bullish or bearish), the script accumulates volume:
– Bullish = volume from green candles (close > open)
– Bearish = volume from red candles (close < open)
• Displays total buy/sell volume and the percentage delta live in a compact table.
🔹 CUSTOMIZATION OPTIONS
• ORB duration (1–15 min)
• Custom session times for London and New York
• Toggle display for ORBs, previous levels (Daily / 4H), volume delta table, watermark
• Fully adjustable ORB and trend colors
• Trend/Momentum settings, table size and position
🔹 ALERTS INCLUDED
• Price breaking above or below the London or NY ORB
• Alerts only trigger after the ORB is set—perfect for breakout entries
🔹 WHY THIS MATTERS
• ORBs are used by institutional traders to define the day’s first true directional intent
• Trend filter avoids chasing noise by adjusting to volatility
• Volume Delta shows who’s in control—buyers or sellers
• Previous levels give natural reaction points for entries, stops, and targets
🔹 DISCLAIMER
This indicator is for educational use only. Not financial advice. Always do your own research and manage risk responsibly.
🔹 JOIN THE COMMUNITY
Want more free tools like this?
Join the free IXTradingHub Discord to access additional indicators, trading resources, and live discussions.
Or check out our VIP suite if you’re ready to take your trading to the next level and start building consistent profitability.
→ Visit IXTradingHub.com to get started.

DeltaStrike — Aggressive Candle Detector by Chaitu50cDeltaStrike — Aggressive Candle Detector
by Chaitu50c
DeltaStrike is a simple and effective tool designed to help traders identify the most aggressive candles on the chart in real time. It works purely on price action and internal candle dynamics, with no reliance on lagging indicators.
The indicator combines delta (directional strength), candle range, and volume to compute an overall aggressiveness score for each candle. When this score exceeds a dynamic threshold based on recent market behavior, the candle is marked as an aggressive move.
Aggressive bullish candles are plotted as green diamonds below the candle, while aggressive bearish candles are plotted as red diamonds above the candle. The goal is to help traders visually spot moments of strong directional pressure, where potential trends or reversals may emerge.
The detection logic adapts automatically to changing market volatility and volume, making it suitable for all instruments and timeframes, including index futures, equities, and forex.
An integrated dashboard on the chart displays live readings of the key components contributing to each candle’s aggressiveness score: delta ratio, range ratio, and volume ratio. This helps traders understand the internal structure of each aggressive move.
Features:
Dynamic aggressiveness detection based on delta, range, and volume
Adaptive threshold for consistent behavior across timeframes and instruments
Clean chart output with clear diamond markers only on selected candles
Live dashboard with internal metrics for advanced analysis
Simple, lightweight, and optimized for intraday and swing trading
Works with any instrument: index, equity, forex, commodity
DeltaStrike is intended as an objective visual aid to help traders focus on genuine moments of strong market intent, filtering out ordinary or passive price movement. It can be used standalone or in combination with your existing trading strategy.

CVD Trend IndikatorCVD Trend Indicator (Cumulative Volume Delta)
This Pine Script indicator is designed to help traders visualize the underlying buying and selling pressure in the market by analyzing the Cumulative Volume Delta (CVD). It provides insights into whether buyers or sellers are more aggressive over time, aiding in trend confirmation and potential reversal identification.
How it Works:
The indicator calculates the Cumulative Volume Delta for each candlestick.
If the candle closes higher than it opened (close > open), its entire volume is considered buying volume (positive delta).
If the candle closes lower than it opened (close < open), its entire volume is considered selling volume (negative delta).
If the candle closes at the same price it opened (close == open), its delta is considered zero.
These individual candle deltas are then cumulatively summed up over time, creating the CVD line. A rising CVD indicates increasing buying pressure, while a falling CVD suggests growing selling pressure.
The indicator also features an optional Simple Moving Average (SMA) of the CVD, which helps smooth out the CVD line and identify the prevailing trend in buying/selling pressure more clearly.
Key Features:
Cumulative Volume Delta (CVD) Line:
Rising CVD (Blue Line): Indicates aggressive buying pressure is dominant, supporting bullish price action.
Falling CVD (Blue Line): Suggests aggressive selling pressure is dominant, supporting bearish price action.
CVD Moving Average (Red Line, optional):
A user-defined SMA of the CVD, which acts as a trend filter for the volume delta.
When the CVD crosses above its MA, it can signal increasing buying momentum.
When the CVD crosses below its MA, it can signal increasing selling momentum.
Session Reset:
The CVD automatically resets at the beginning of each new trading session (daily by default). This provides a fresh perspective on the day's accumulated buying or selling pressure, which is particularly useful for day traders.
Background Color Visuals:
The indicator panel's background changes color to visually represent periods of dominant buying pressure (green background when CVD > CVD MA) or selling pressure (red background when CVD < CVD MA), offering a quick glance at the market's underlying bias.
Trading Insights:
Trend Confirmation: Use a rising CVD (and its MA) to confirm an uptrend, or a falling CVD (and its MA) to confirm a downtrend.
Divergences: Look for CVD Divergences as potential reversal signals:
Bullish Divergence: Price makes a lower low, but CVD makes a higher low (suggests selling pressure is weakening).
Bearish Divergence: Price makes a higher high, but CVD makes a lower high (suggests buying pressure is weakening).
Momentum Shifts: Sudden, sharp changes in the CVD's direction or its cross over/under its MA can signal shifts in market momentum.
Support/Resistance Confirmation: Observe CVD behavior around key price levels. Weakening buying pressure at resistance or weakening selling pressure at support can confirm the strength of these levels.
Customization:
showMA: Toggle the visibility of the CVD's Moving Average.
maLength: Adjust the period for the CVD's Moving Average to control its sensitivity to recent price action. A shorter length makes it more reactive, while a longer length makes it smoother.
Disclaimer: No indicator is foolproof. Always use the CVD Trend Indicator in conjunction with other technical analysis tools, price action, and robust risk management strategies. Backtesting and forward testing are crucial for understanding its effectiveness in different market conditions and timeframes.

CVD Divergence & Volume ProfileThis Pine Script indicator, named "CVD Divergence & Volume Profile," is designed to identify potential trading opportunities by combining Cumulative Volume Delta (CVD) divergence with Volume Profile levels and an optional Simple Moving Average (SMA) trend filter. It plots signals directly on the price chart.
Here's a breakdown of what each component does and how to potentially trade with it:
1. Cumulative Volume Delta (CVD) Divergence
What it does: CVD measures the cumulative difference between buying and selling volume. A rising CVD indicates more buying pressure, while a falling CVD indicates more selling pressure. Divergence occurs when the price action contradicts the CVD's direction, suggesting a potential shift in momentum or trend reversal.
Bearish Divergence: The price makes a higher high, but the CVD makes a lower high (or fails to make a new high). This suggests that despite the price increasing, the underlying buying pressure is weakening.
Bullish Divergence: The price makes a lower low, but the CVD makes a higher low (or fails to make a new low). This suggests that despite the price decreasing, the underlying selling pressure is weakening.
Visualization:
Red triangle pointing down on the chart indicates a Bearish Divergence signal.
Green triangle pointing up on the chart indicates a Bullish Divergence signal.
2. Volume Profile Levels (VAH, VAL, POC)
What it does: The indicator calculates simplified Volume Profile levels over a user-defined vp_range (number of candles). These levels represent areas where significant trading activity has occurred:
VAH (Value Area High): The upper boundary of the "Value Area," where 70% of the volume traded.
VAL (Value Area Low): The lower boundary of the "Value Area," where 70% of the volume traded.
POC (Point of Control): The price level within the vp_range where the most volume was traded.
Significance: These levels often act as significant support and resistance zones.
Visualization:
Orange lines for VAH and VAL.
Yellow line for POC.
Zone Proximity (zone_thresh): The indicator only generates divergence signals if the current close price is within a specified percentage zone_thresh of either VAH, VAL, or POC. This filters signals to areas of high liquidity and potential turning points.
3. Trend Filter (SMA)
What it does: This is an optional filter (use_trend_filter) that uses a Simple Moving Average (sma_period, default 200).
Significance: It helps ensure that divergence signals are traded in alignment with the broader market trend, potentially increasing their reliability.
For long signals (bullish divergence), the price (close) must be above the SMA (indicating an uptrend).
For short signals (bearish divergence), the price (close) must be below the SMA (indicating a downtrend).
Visualization: A blue line on the chart representing the SMA.
How to Trade with It (Potential Strategies)
The indicator aims to provide high-probability entry points by combining multiple confirming factors. Here's how you might interpret and trade the signals:
Identify Divergence: Look for the triangle signals on your chart (red for bearish, green for bullish).
Confirm Proximity to Volume Profile Levels: The signal itself confirms that the price is near a significant Volume Profile level (VAH, VAL, or POC). These are areas where price often reacts.
Bullish Signal (Green Triangle): This suggests buying momentum is returning after a price decline, especially when the price is near VAL or POC, which might act as support.
Bearish Signal (Red Triangle): This suggests selling momentum is increasing after a price rally, especially when the price is near VAH or POC, which might act as resistance.
Check Trend Alignment (SMA Filter):
For a long trade: You would ideally want to see a green triangle (bullish divergence) while the price is above the blue SMA line. This indicates a bullish divergence confirming a potential bounce within an existing uptrend.
For a short trade: You would ideally want to see a red triangle (bearish divergence) while the price is below the blue SMA line. This indicates a bearish divergence confirming a potential rejection within an existing downtrend.
Entry and Exit Considerations:
Entry: Consider entering a trade on the candle where the signal appears, or on the subsequent candle for confirmation.
Stop Loss: For a long trade, a logical stop-loss could be placed below the lowest point of the divergence, or below the VAL/POC if the signal occurred near it. For a short trade, above the highest point of the divergence or VAH/POC.
Take Profit: Targets could be set at the opposite Volume Profile level, previous swing highs/lows, or using a fixed risk-reward ratio.
Example Trading Scenario:
Long Trade: You see a green triangle (bullish divergence) printed on the chart. You notice the price is currently at the VAL (orange line). You check the blue SMA line and confirm that the price is above it (uptrend). This confluence of factors (bullish divergence, support at VAL, and uptrend) provides a strong potential long entry signal. You might enter, place your stop loss just below VAL, and target VAH or the next resistance level.
Short Trade: You see a red triangle (bearish divergence). The price is at the VAH (orange line). The price is also below the blue SMA line (downtrend). This suggests a potential short entry. You might enter, place your stop loss just above VAH, and target VAL or the next support level.

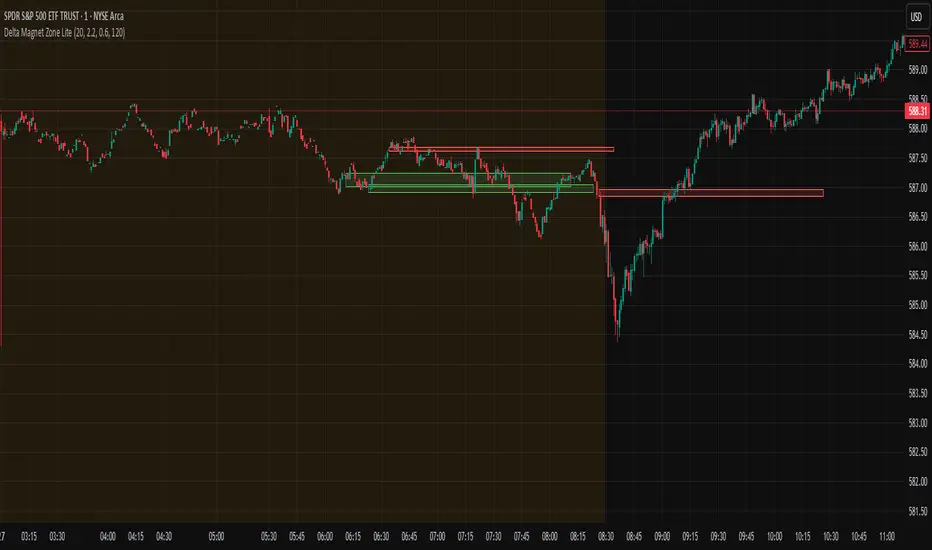
Delta Magnet Zone LiteDelta Magnet Zone Lite is exactly what it sounds like. It is areas where price cold potentially act as a magnet zone for price. Delta Magnet Zone Lite is a lightweight yet powerful visual tool that highlights potential liquidity traps and high-probability reversal zones based on volume spikes and wick imbalances. Designed for precision traders, this indicator visually marks key “magnet” zones where price may react, reverse, or consolidate due to prior aggressive buying or selling activity.
🔹 Core Logic:
Volume Spike Detection
Identifies candles with significantly higher volume than the moving average (customizable). These are likely areas of institutional interest or stop-hunt events.
Wick Ratio Analysis
Measures the size of the upper or lower wick relative to the total candle range. When combined with volume spikes, this helps detect:
Bullish Traps: Large lower wicks with strong buying volume
Bearish Traps: Large upper wicks with strong selling volume
Smart Zone Marking
When trap conditions are met, the script draws a semi-transparent colored box (green for bullish, red for bearish) that extends forward in time, highlighting a magnet zone—a price area likely to be retested or respected by future price action.
🛠 Customization Options:
Volume Spike Threshold
Adjust the multiplier for defining what qualifies as "high volume" relative to the average.
Wick Ratio Sensitivity
Fine-tune how extreme the wick size must be to qualify as a trap.
Zone Lifetime (Lookback)
Control how many bars each zone remains active on the chart.
Toggle Visibility
Turn bullish or bearish zones on/off independently for clean charting.
Ideal Use Cases:
Spotting hidden liquidity zones
Identifying exhaustion points in fast markets
Tracking institutional order imbalances
Enhancing confirmation for entry/exit signals
Whether you're trading intraday breakouts or swing-level reversals, Delta Magnet Zone Lite brings clarity to key reaction levels derived from raw price and volume behavior.
Project SynthIntroducing Project Synth !
Inspired by Pace of Tape and Cumulative Delta I created Project Synth in order to aggregate volume flow data across multiple marketsfor two primary reasions:
Traditional orderflow tools are not available on Tradingview. My script attempts to bring an original; calculus-based approach to creating not only an alternative for traditional orderflow tools, but also a more accurate one.
In order to detect genuine buying and selling pressure that cannot be easily manipulated. I did this because while I've always enjoyed concept behind both of those tools, I did not think they captured enough data to be useful. By analyzing assets that move together (positive correlation) and assets that move inversely (negative correlation), my system aims to fix the fundamental problems with those indicators and create an objective view of market sentiment based on aggregate orderflow.
Some more detailed explanations (using QQQ and SQQQ as an example):
Inverse Market Dynamics (QQQ vs SQQQ):
In an inverse market like SQQQ, aggressive buyers hit the ask when they expect the underlying (QQQ) to fall, while passive buyers wait on the bid hoping for cheaper inverse exposure. When QQQ rallies, SQQQ sees aggressive selling (people dumping their bearish bets) hitting bids, while passive sellers sit on the ask hoping to exit at better prices. The aggression flows opposite to the underlying market direction.
Why Utilizing Both Markets Provides A More Accurate Delta:
Watching both QQQ and SQQQ gives cross-validation - real buying pressure in QQQ should coincide with selling pressure in SQQQ. If you see buying in QQQ but also buying in SQQQ, that's a conflicting signal suggesting the move might be artificial or driven by other factors. The inverse relationship acts as a confirmation filter, making false signals much harder to generate.
Multiple Markets = Authentic Pressure:
The more unique, important markets you track, the harder it becomes to create fake delta moves. Real institutional buying/selling pressure affects multiple correlated assets simultaneously in predictable patterns - you can't easily manipulate tech stocks, treasury bonds, VIX, and currency pairs all at once to create a false signal. Each additional market acts as a fraud detection layer, ensuring the delta measurement reflects genuine ecosystem-wide buying and selling pressure rather than isolated manipulation or noise.
My Suggestions For Usage:
In order to keep the explanation simple and short for now, I suggest using it just like a cumulative delta indicator. For example: let's say you were watching CME_MINI:ES1! , and you had a resistance level at 6000. When the price reaches your resistance level, you would be looking for a significant divergence between price and Delta. Price : rising, Delta : falling. This means that even though the price was going up, strong and aggressive sellers are jumping in more and more, this can be used as a confirmation tool for a resistance level.
Notes For Moderators, Authors and Users:
Firstly, to the best of my knowledge, I have not been able to find many tools built around the concept of cumulative delta or pace of tape. While I know there are a couple projects, none to the magnitude of synthetically recreating these tools via an algorithm designed around basic calculus principles. While tools like Volume Delta are built in, they do not attempt to capture an accurate picture of aggregated orderflow from what I understand.
Secondly, it needs to be noted that tool aims to create an approximation of buying and selling pressure. To my knowledge it is not possible to create an accurate full picture, at least not within the limitations of Tradingview.

Bullish Volume AnomalyAnomaly is designed to spot hidden bullish accumulation before price actually breaks out, by blending a trend-aware volume measure with a volatility-adjusted price channel. Here’s how it works:
First, it runs a simple ATR-based zigzag to identify the current swing direction. Volume is then signed (+ for up-trends, – for down-trends) and cumulatively summed. By converting that cumulative signed volume into a z-score over the past 480 bars, we get a sense of when buying or selling pressure is unusually strong relative to its own history.
At the same time, price itself is normalized into a z-score over the same 480-bar window, and its change over that period is also tracked. These two measures—volume z-score (s) and price z-score (p)—are compared, and the indicator looks for moments when s outpaces p by at least two standard deviations (s – p > 2), while price momentum change remains low (c < 1) and the net volume is positive (s > 0). That combination flags instances where heavy buying is taking place but price hasn’t yet reacted.
To define a dynamic trading zone, it plots a 288-bar EMA of price as the middle band (t2), and builds upper and lower bands around it using the average close-to-open range multiplied by a user-set factor. The lower band (t1) sits beneath the EMA by that volatility-based margin. A signal fires only when the bar’s high stays below t1—meaning price is still “sleeping” under the lower volatility boundary even as bullish volume builds up.
Together, these filters home in on anomalies: strong, trend-aligned volume surges that outstrip price movement, occurring while price sits below its lower volatility band. In practice, that often marks early accumulation before a breakout. You can tweak the ATR length and multiplier for the zigzag, as well as the channel period and range factor, to suit different markets or timeframes.

Footprint BoxesThe Footprint Boxes indicator takes each higher-timeframe candle and builds a mini “footprint” map of where buying and selling happened within that bar’s range. You choose how many price bins to split the candle into and which lower timeframe to sample. For each small interval it grabs the signed volume (positive when the close is above the open, negative when below) and distributes that volume evenly across every bin touched by the price move in that interval.
Once the bar closes , the script finds the true high and low of all the lower-timeframe candles that make up the parent bar, divides that span into your chosen number of bins, and sums up the signed volume in each bin. It then draws a row of colored boxes beside the bar: green-tinted boxes for net buying and red-tinted ones for net selling, with shade intensity proportional to the percentage of total volume in that bin . Each box is labeled with its percentage of the bar’s total volume delta.
Finally, it draws one extra box with a bold white border showing the bar’s overall delta (net buying minus selling) as an absolute number. This gives you both a granular view of intra-bar activity and a quick glance at whether the buyers or sellers dominated the entire candle.

Trailing Cumulative Volume DeltaShort Description:
A dynamic volume delta indicator that calculates a trailing sum of net buying/selling pressure over a user-defined number of recent bars, offering a more adaptive view of order flow momentum compared to fixed-anchor CVD.
Overview:
The Trailing Cumulative Volume Delta (TCVD) indicator provides a powerful way to analyze market sentiment by tracking the net difference between buying and selling volume. Unlike traditional Cumulative Volume Delta (CVD) indicators that typically reset at fixed intervals (e.g., daily, weekly), the TCVD calculates a rolling sum of volume delta over a specified number of recent bars. This "trailing" approach offers a more fluid and responsive measure of recent order flow dynamics.
How it Works:
Per-Bar Delta Calculation: For each bar on your chart, the indicator first calculates the net Volume Delta. This is done by looking at a finer, user-configurable Lower Timeframe (e.g., 1-minute data for a 15-minute chart bar) to determine the aggressive buying vs. selling volume within that bar.
Trailing Sum: The indicator then sums these individual per-bar net deltas over a user-defined Trailing Bars lookback period. For example, if "Trailing Bars" is set to 20, the TCVD value will represent the cumulative net delta of the last 20 bars.
Visualization:
The TCVD is plotted in a "MACD-Columns-Style" in a separate pane.
Teal: When the TCVD value is increasing (suggesting growing net buying pressure or diminishing net selling pressure over the trailing period).
Red: When the TCVD value is decreasing (suggesting growing net selling pressure or diminishing net buying pressure over the trailing period).
White: When it is returning to the mean.
How to Interpret and Use TCVD:
Trend Strength & Momentum:
A rising TCVD suggests that, on average over the trailing period, buying pressure is dominant or strengthening. This can confirm bullish price action or indicate underlying strength.
A falling TCVD suggests that selling pressure is dominant or strengthening, potentially confirming bearish price action or indicating weakness.
Divergences:
Unlike other Divergences, the CVD has two different types of Divergences: a) Absorption and b) Exhaustion. You only want to trade the Absorption pattern.
Zero Line Crossovers:
TCVD crossing above the zero line can indicate a shift towards net positive buying pressure over the lookback period.
TCVD crossing below the zero line can indicate a shift towards net positive selling pressure.
Confirmation: Use TCVD to confirm breakouts or breakdowns. A price breakout accompanied by a strongly rising TCVD is generally more reliable.
Key Settings:
Trailing Bars: (Default: 10)
Determines the number of recent bars to include in the cumulative delta sum.
Shorter periods make the TCVD more responsive to immediate changes.
Longer periods provide a smoother, longer-term view of order flow.
Use custom timeframe: (Checkbox, Default: false)
Allows you to override the automatic selection of the lower timeframe for delta calculation.
Timeframe for Delta Calculation: (Default: "1" - 1 minute)
Specifies the lower timeframe data used to calculate the volume delta for each individual chart bar.
Choosing a very fine timeframe (e.g., seconds) can provide high precision but may be limited by data availability or processing load.
If "Use custom timeframe" is unchecked, the script attempts to choose a sensible default based on your chart's timeframe (e.g., "1S" for second charts, "1" for intraday, "5" for daily, "60" for weekly+).
Examples:
Confirming Breakout Strength:
Price breaks out above a significant resistance level.
If the TCVD is also sharply rising and has perhaps crossed above its zero line, it provides confirmation that strong buying interest is fueling the breakout, increasing confidence in its validity.
Important Notes:
This indicator requires reliable volume data from your broker/data feed to function correctly. If your chart does not have volume, or if the volume data is unreliable, the TCVD will not be accurate.
Like all indicators, TCVD is best used as part of a comprehensive trading strategy, in conjunction with price action analysis and other indicators or tools.
Experiment with the Trailing Bars and Timeframe for Delta Calculation settings to find what best suits your trading style, the asset you are analyzing, and the chart timeframe you are using.
Feel free to modify this, add your personal touch, or include specific screenshots when you publish!

CVD Divergenz System – modular with Exchange + LabelsA smart volume-based strategy tool using CVD divergence, ATR-based risk management, and Open Interest filters — now with visual chart labels and exchange switching.
Designed for crypto traders who want precise entry signals, volume insight, and a clean UI.
🔍 Key Features:
✅ CVD Divergence Detection
Automatically detects bullish or bearish divergences between price and cumulative delta (CVD)
✅ Open Interest Logic (Simulated)
Signals are only valid when OI is rising – otherwise a warning is issued
✅ ATR-Based Entry, Stop & Target Zones
Auto-calculated based on your chosen R multiple (e.g., 1.5R), plotted in the chart
✅ Visual Dashboard Panel (table)
Compact panel with CVD, OI change, ATR, signal status, and selected exchange — always visible in top-right
✅ Exchange Selector + Fallback to Binance
Choose between Binance, Bybit, Bitget, or Coinbase — if data is unavailable, Binance is used automatically
✅ Modular Chart Labels
Optionally display 📈 LONG, 📉 SHORT or ⚠️ WARNING labels directly on the chart with a toggle
✅ Alerts Built-In
Get notified instantly when a setup triggers (long, short, or warning) — works with app, popup, or webhook
✅ Fully Modular Controls
Enable or disable the dashboard, trade zones, and labels via simple checkboxes
⚠️ Technical Notes:
CVD is calculated from delta volume (volume * sign(close - open)) — not true order flow
Open Interest is simulated using volume as a placeholder (due to Pine Script limitations)
Best suited for 5–30min timeframes on crypto futures pairs like BTCUSDT, ETHUSDT, etc.
💡 Pro Tips:
Use near key support/resistance zones or liquidity levels
Combine with price action and higher timeframe confluence
Alerts work best with "Once Per Bar Close" trigger setting
📈 Built to support faster decisions, cleaner setups, and institutional-level insights — all in one tool.

TrueDelta Candles📖 Description:
TrueDelta Candles is a precision tool for traders who want deeper insight into market sentiment through real-time volume delta analysis. Rather than using traditional volume bars, this indicator colors each chart candle based on the net volume delta—the difference between buying and selling volume—fetched from a lower timeframe.
🚀 Key Features:
🎯 Real Candle Coloring: Colors actual price candles based on delta volume—green (buying pressure), red (selling pressure).
⏱️ Multi-Timeframe Volume Analysis: Automatically selects the appropriate lower timeframe for better delta approximation, or lets you set a custom one.
🔬 Order Flow Insight: Visualizes the tug-of-war between buyers and sellers within each candle.
⚡ Lightweight & Non-Intrusive: No clutter—just clean color overlays on your chart candles.
🔄 Live Updating: Responds instantly as new data arrives.
🧠 Ideal For:
Intraday and scalping strategies.
Momentum and breakout traders.
Order flow enthusiasts looking for a visual edge.
🛠️ How It Works:
Behind the scenes, the script uses ta.requestVolumeDelta() to retrieve granular buy/sell volume data from a lower timeframe. The net delta volume then determines whether the candle is colored green (positive delta) or red (negative delta). This makes it easy to spot when market pressure aligns or diverges from price action.
⚙️ Settings:
Use Custom Timeframe: Manually select the lower timeframe used for delta calculation (e.g., "1", "5").
Default Auto Mode: Automatically adapts to your current chart resolution for optimal data balance.
If you're serious about understanding the real dynamics behind every candle, TrueDelta Candles adds an essential layer of volume-based context that price alone can't offer.

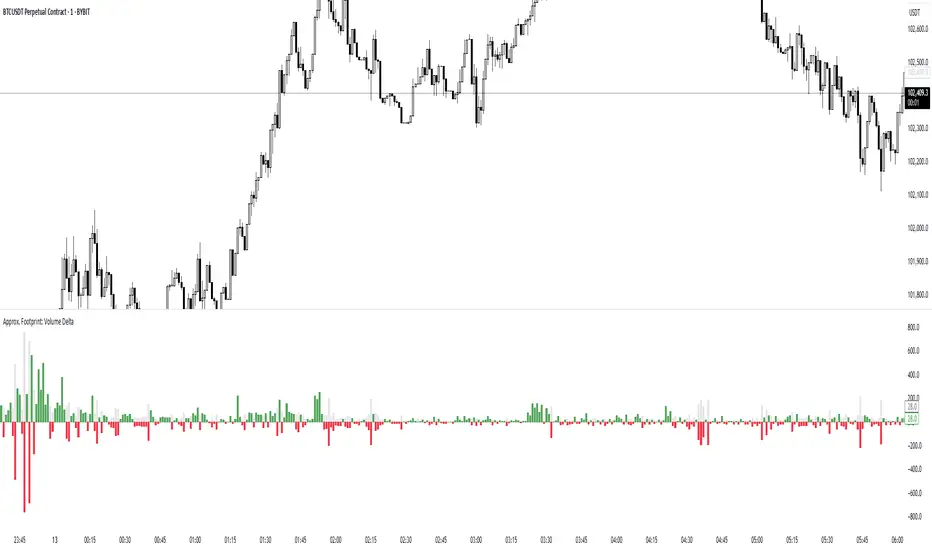
Approx. Footprint: Volume DeltaThis indicator brings you a simplified “footprint” view by charting the volume delta—the imbalance between bullish and bearish volume—alongside total bar volume.
Delta Bars: Green/red columns show where buyers (close > open) or sellers (close < open) dominated each bar.
Total Volume: Semi-transparent gray columns in the background give you overall context.
No Hidden Data: Works on any symbol/timeframe without tick-by-tick or bid/ask feeds.
Use it to quickly spot bars with strong buying or selling pressure, identify momentum shifts, and confirm breakouts or reversals—all within TradingView’s standard volume streams.
Multi-Layer Volume Profile [BigBeluga]A powerful multi-resolution volume analysis tool that stacks multiple profiles of historical trading activity to reveal true market structure.
This indicator breaks down total and delta volume distribution across time at four adjustable depths — enabling traders to spot major POCs, volume shelves, and zones of price acceptance or rejection with unmatched clarity.
🔵 KEY FEATURES
Multi-Layer Volume Profiles:
Up to 4 separate volume profiles are stacked on the chart:
- Profile 1: Full period
- Profile 2: Half-length
- Profile 3: Quarter-length
- Profile 4: One-eighth-length
This layering helps traders assess confluence across different time horizons.
Custom Bin Resolution:
Each profile uses a customizable number of bins to control visual precision.
More bins = higher granularity, fewer bins = smoother profile.
Precise POC Highlighting:
The price level with the maximum traded volume in each profile is highlighted with a thick blue POC line.
This key level shows the most accepted price for each period.
Total and Delta Volume Labels:
- Total Volume: Displays cumulative volume over the profile period at the top of the profile box.
- Delta Volume: The difference between bullish and bearish volume is labeled at the base, showing directional pressure.
Positive delta = buyer dominance, negative delta = seller dominance.
Range Levels:
Each profile includes horizontal reference lines showing its high, low, bounds.
These edges often align with price reaction zones and become future resistance/support.
🔵 HOW IT WORKS
For each active profile, the indicator:
- Collects price range (highs/lows) across the selected `length`
- Divides this range into equal bins
- Assigns volume into bins based on candle close location
- Aggregates volume per bin to form the profile (polylines)
Separately tracks:
- Total volume (sum of all candles in range)
- Delta volume (sum of candle volumes: positive for bullish, negative for bearish closes)
Highlights the bin with maximum volume (POC)
and marks it with a thick blue line.
Adds auxiliary lines for high/low of each profile box
and total/delta volume tags with tooltips.
🔵 USAGE
Spot Acceptance Zones:
Thick, flat areas on the profile show where price stayed longest — ideal for building positions.
Identify Rejection Zones:
Thin volume areas signal price rejection and are often used for stop placement or entries.
Delta Confirmation:
Use strong positive/negative delta readings as directional bias confirmation for breakout trades.
Confluence Detection:
Watch for overlapping POCs between layers to identify extremely strong support/resistance zones.
🔵 CONCLUSION
Multi-Layer Volume Profile equips traders with a deeply layered market structure view.
Whether you're scalping intraday levels or analyzing macro support zones, the ability to stack volume perspectives, visualize directional delta, and anchor POCs provides an edge in anticipating market moves.
Use this tool to validate entries, confirm structure, and make more informed, volume-aware trading decisions.

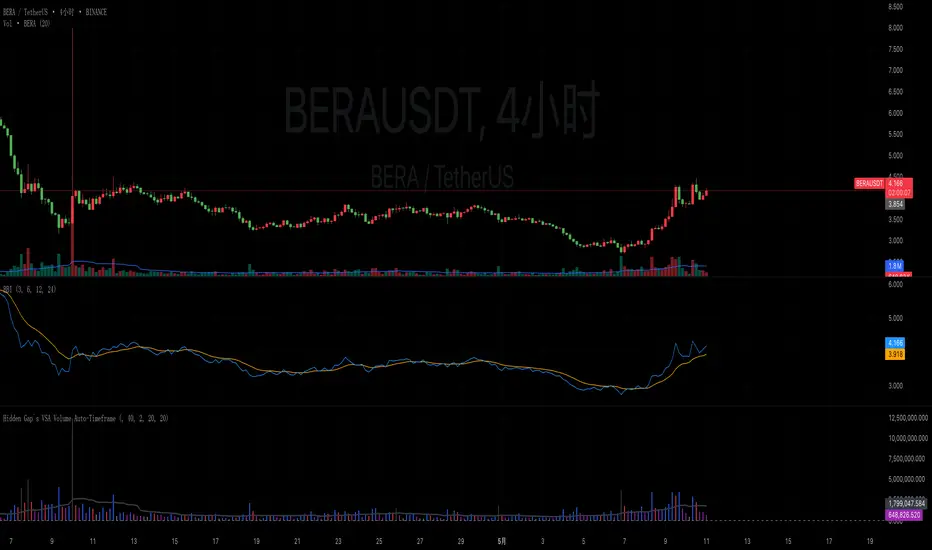
Hidden Gap`s VSA Volume Auto-TimeframeHidden Gap's VSA Volume with Auto-Timeframe Adaptation
Enhanced Version of Classic Volume Spread Analysis Indicator
Description:
This evolved version of the original "Hidden Gap's VSA Volume" indicator introduces intelligent timeframe adaptation while preserving its core Volume Spread Analysis (VSA) logic. The key enhancement automatically synchronizes volume calculations with your chart's current timeframe, eliminating manual resolution adjustments.
New Features:
✅ Auto-Timeframe Detection
Dynamically adjusts to any chart timeframe (1M/5M/1H/4H/D/W/M)
✅ Smart Resolution Switching
Seamlessly works across multiple timeframes without parameter changes
✅ Manual Override Option
Retains custom resolution input for multi-timeframe analysis (e.g., view weekly volume on daily charts)
✅ Modernized Engine
Upgraded to Pine Script v6 for optimal TradingView performance
Core Functionality Preserved:
• Multi-layer volume analysis using 40/20/2-period comparisons
• Color-coded histogram detecting:
Black: 40-period high volume
Gray: 20-period low volume
Purple: 2-period volume contraction
Blue/Red: Immediate volume changes
• Integrated 20-period SMA reference line
Usage Scenarios:
Intraday Trading: Auto-adjusts from 1-minute to 4-hour charts
Multi-Timeframe Analysis: Compare current volume against higher timeframe patterns
Swing Trading: Maintain consistent analysis across D/W/M timeframes
Aggressive Volume 📊 Indicator: Aggressive Volume – Simulated Buy/Sell Pressure
Aggressive Volume estimates delta volume using candle data to simulate the market’s internal buy/sell pressure. It helps visualize how aggressive buyers or sellers are moving the price without needing full order flow access.
⚙️ How It Works:
Calculates simulated delta volume based on candle direction and volume.
Bullish candles (close > open) suggest dominance by buyers.
Bearish candles (close < open) suggest dominance by sellers.
Delta is the difference between simulated buying and selling pressure.
🔍 Key Features:
Visual bars showing aggressive buyer vs seller dominance
Helps spot trend strength, momentum bursts, and potential reversals
Simple, effective, and compatible with any timeframe
Lightweight and ideal for scalping, day trading, and swing trading
💡 How to Use:
Look for strong positive delta during bullish trends for confirmation.
Watch for delta weakening or divergence as potential reversal signals.
Combine with trend indicators or price action for enhanced accuracy.
📊 Indicador: Volume Agressivo – Pressão de Compra/Venda Simulada
Volume Agressivo estima o delta de volume utilizando dados dos candles para simular a pressão interna de compra/venda do mercado. Ele ajuda a visualizar como os compradores ou vendedores agressivos estão movendo o preço, sem precisar de acesso completo ao fluxo de ordens.
⚙️ Como Funciona:
Calcula o delta de volume simulado com base na direção do candle e no volume.
Candles de alta (fechamento > abertura) indicam predominância de compradores.
Candles de baixa (fechamento < abertura) indicam predominância de vendedores.
O delta é a diferença entre a pressão de compra e venda simulada.
🔍 Principais Funcionalidades:
Barras visuais mostrando a dominância de compradores vs vendedores agressivos
Ajuda a identificar a força da tendência, explosões de momentum e possíveis reversões
Simples, eficaz e compatível com qualquer período de tempo
Leve e ideal para scalping, day trading e swing trading
💡 Como Usar:
Procure por delta positivo forte durante tendências de alta para confirmação.
Observe o delta enfraquecendo ou divergências como sinais de possível reversão.
Combine com indicadores de tendência ou price action para maior precisão.

Puts vs Longs vs Price Oscillator SwiftEdgeWhat is this Indicator?
The "Low-Latency Puts vs Longs vs Price Oscillator" is a custom technical indicator built for TradingView to help traders visualize buying and selling activity in a market without access to order book data. It displays three lines in an oscillator below the price chart:
Green Line (Longs): Represents the strength of buying activity (bullish pressure).
Red Line (Puts): Represents the strength of selling activity (bearish pressure).
Yellow Line (Price): Shows the asset’s price in a scaled format for direct comparison.
The indicator uses price movements, volume, and momentum to estimate when buyers or sellers are active, providing a quick snapshot of market dynamics. It’s optimized for fast response to price changes (low latency), making it useful for both short-term and longer-term trading strategies.
How Does it Work?
Since TradingView doesn’t provide direct access to order book data (which shows real-time buy and sell orders), this indicator approximates buying and selling pressure using commonly available data: price, volume, and a momentum measure called Rate of Change (ROC). Here’s how it combines these elements:
Price Movement: The indicator checks if the price is rising or falling compared to the previous candlestick. A rising price suggests buying (longs), while a falling price suggests selling (puts).
Volume: Volume acts as a "weight" to measure the strength of these price moves. Higher volume during a price increase boosts the green line, while higher volume during a price decrease boosts the red line. This mimics how large orders in an order book would influence the market.
Rate of Change (ROC): ROC measures how fast the price is changing over a set period (e.g., 5 candlesticks). It adds a momentum filter—strong upward momentum reinforces buying signals, while strong downward momentum reinforces selling signals.
These components are calculated for each candlestick and summed over a short lookback period (e.g., 5 candlesticks) to create the green and red lines. The yellow line is simply the asset’s closing price scaled down to fit the oscillator’s range, allowing you to compare buying/selling strength directly with price action.
Why Combine These Elements?
The combination of price, volume, and ROC is intentional and synergistic:
Price alone isn’t enough—it tells you what happened but not how strong the move was.
Volume adds context by showing the intensity behind price changes, much like how order book volume indicates real buying or selling interest.
ROC ensures the indicator captures momentum, filtering out weak or random price moves and focusing on significant trends, similar to how aggressive order execution might appear in an order book.
Together, they create a balanced picture of market activity that’s more reliable than any single factor alone. The goal is to simulate the insights you’d get from an order book—where you’d see buy/sell imbalances—using data available in TradingView.
How to Use It
Setup:
Add the indicator to your chart via TradingView’s Pine Editor by copying and pasting the script.
Adjust the inputs to suit your trading style:
Lookback Period: Number of candlesticks (default 5) to sum buying/selling activity. Shorter = more responsive; longer = smoother.
Price Scale Factor: Scales the yellow price line (default 0.001). Increase for high-priced assets (e.g., 0.01 for indices like DAX) or decrease for low-priced ones (e.g., 0.0001 for crypto).
ROC Period: Candlesticks for momentum calculation (default 5). Shorter = faster response.
ROC Weight: How much momentum affects the signal (default 0.5). Higher = stronger momentum influence.
Volume Threshold: Minimum volume multiplier (default 1.5) to boost signals during high activity.
Reading the Oscillator:
Green Line Above Yellow: Strong buying pressure—price is rising with volume and momentum support. Consider this a bullish signal.
Red Line Above Yellow: Strong selling pressure—price is falling with volume and momentum support. Consider this a bearish signal.
Green/Red Crossovers: When the green line crosses above the red, it suggests buyers are taking control. When the red crosses above the green, sellers may be dominating.
Yellow Line Context: Compare green/red lines to the yellow price line to see if buying/selling strength aligns with price trends.
Trading Examples:
Bullish Setup: Green line spikes above yellow after a price breakout with high volume (e.g., DAX opening jump). Enter a long position if confirmed by other indicators.
Bearish Setup: Red line rises above yellow during a price drop with increasing volume. Look for a short opportunity.
Reversal Warning: If the green line stays high while price (yellow) flattens or drops, it could signal overbought conditions—be cautious.
What Makes It Unique?
Unlike traditional oscillators like RSI or MACD, which focus solely on price momentum or trends, this indicator blends price, volume, and momentum into a three-line system that mimics order book dynamics. Its low-latency design (short lookback and no heavy smoothing) makes it react quickly to market shifts, ideal for volatile markets like DAX or forex. The visual separation of buying (green) and selling (red) against price (yellow) offers a clear, intuitive way to spot imbalances without needing complex data.
Tips and Customization
Volatile Markets: Use a shorter lookback (e.g., 3) and ROC period (e.g., 3) for faster signals.
Stable Markets: Increase lookback (e.g., 10) for smoother, less noisy lines.
Scaling: If the green/red lines dwarf the yellow, adjust Price Scale Factor up (e.g., 0.01) to balance them.
Experiment: Test on your asset (stocks, crypto, indices) and tweak inputs to match its behavior.

Intraday Macro & Flow Indicator# IntraMacroFlow Indicator
## Introduction
IntraMacroFlow is a volume and delta-based indicator that identifies significant price movements within trading sessions. It generates signals when volume spikes coincide with quality price movement, filtered by RSI to avoid overbought/oversold conditions.
> **Note:** This indicator provides multiple signals and should be combined with additional analysis methods such as support/resistance, trend direction, and price action patterns.
## Inputs
### Volume Settings
* **Volume Lookback Period** (14) - Number of bars for volume moving average calculation
* **Volume Threshold Multiplier** (1.5) - Required volume increase over average to generate signals
* **Delta Threshold** (0.3) - Required close-to-open movement relative to bar range (higher = stronger movement)
### Session Configuration
* **Use Dynamic Session Detection** (true) - Automatically determine session times
* **Highlight Market Open Period** (true) - Highlight first third of trading session
* **Highlight Mid-Session Period** (true) - Highlight middle portion of trading session
* **Detect Signals Throughout Whole Session** (true) - Find signals in entire session
* **Session Time** ("0930-1600") - Trading hours in HHMM-HHMM format
* **Session Type** ("Regular") - Select Regular, Extended, or Custom session
### Manual Session Settings
Used when dynamic detection is disabled:
* **Manual Session Open Hour** (9)
* **Manual Session Open Minute** (30)
* **Manual Session Open Duration** (60)
* **Manual Mid-Session Start Hour** (12)
* **Manual Mid-Session End Hour** (14)
## How It Works
The indicator analyzes each bar using three primary conditions:
1. **Volume Condition**: Current volume > Average volume × Threshold
2. **Delta Condition**: |Close-Open|/Range > Delta threshold
3. **Time Condition**: Bar falls within configured session times
When all conditions are met:
* Bullish signals appear when close > open and RSI < 70
* Bearish signals appear when close < open and RSI > 30
## Display Elements
### Shapes and Colors
* Green triangles below bars - Bullish signals
* Red triangles above bars - Bearish signals
* Blue background - Market open period
* Purple background - Mid-session period
* Bar coloring - Green (bullish), Red (bearish), or unchanged
### Information Panel
A dynamic label shows:
* Current volume relative to average (Vol)
* Delta value for current bar (Delta)
* RSI value (RSI)
* Session status (Active/Closed)
## Calculation Method
```
// Volume Condition
volumeMA = ta.sma(volume, lookbackPeriod)
volumeCondition = volume > volumeMA * volumeThreshold
// Delta Calculation (price movement quality)
priceRange = high - low
delta = math.abs(close - open) / priceRange
deltaCondition = delta > deltaThreshold
// Direction and RSI Filter
bullishBias = close > open and entrySignal and not (rsi > 70)
bearishBias = close < open and entrySignal and not (rsi < 30)
```
## Usage Recommendations
### Suitable Markets
* Equities during regular trading hours
* Futures markets
* Forex during active sessions
* Cryptocurrencies with defined volume patterns
### Recommended Timeframes
* 1-minute to 1-hour (optimal: 5 or 15-minute)
### Parameter Adjustments
* For fewer but stronger signals: increase Volume Threshold (2.0+) and Delta Threshold (0.4-0.6)
* For more signals: decrease Volume Threshold (1.2-1.5) and Delta Threshold (0.2-0.3)
### Usage Tips
* Combine with trend analysis for higher-probability entries
* Focus on signals occurring at session boundaries and mid-session
* Use opposite signals as potential exit points
* Configure alerts to receive notifications when signals occur
## Additional Notes
* RSI parameters are fixed at 14 periods with 70/30 thresholds
* The indicator handles overnight sessions correctly
* Fully compatible with TradingView alerts
* Customizable visual elements
## Release Notes
Initial release: This is a template indicator that should be customized to suit your specific trading strategies and preferences.

Volume Delta DashboardHow It Works:
This script creates a Volume Delta Dashboard on TradingView, which helps traders visualize the balance between buying and selling volume (Volume Delta) directly on the chart. Here's a breakdown of the key components:
Volume Delta Calculation:
The script calculates the Volume Delta by comparing the volume of bars where the price closed higher (buying pressure) to those where the price closed lower (selling pressure).
Positive Volume Delta (green background) indicates more buying activity than selling, suggesting upward price movement. Negative Volume Delta (red background) indicates more selling than buying, signaling a potential downward move.
Smoothing with EMA:
To make the volume delta trend smoother and more consistent, an Exponential Moving Average (EMA) of the Volume Delta is used. This helps to reduce noise and highlight the prevailing buying or selling pressure over a 14-period.
Dynamic Position Selection:
The user can choose where the Volume Delta dashboard table will appear on the chart by selecting a position: top-left, top-right, bottom-left, or bottom-right. This makes the indicator adaptable to different chart setups.
Coloring:
The background of the table changes color based on the value of the Volume Delta. Green indicates a positive delta (more buyers), and Red indicates a negative delta (more sellers).
Use of This Strategy:
This Volume Delta Dashboard strategy is particularly useful for traders who want to:
Monitor Market Sentiment:
By observing the volume delta, traders can get a sense of whether there is more buying or selling pressure in the market. Positive volume delta can indicate a bullish sentiment, while negative delta can point to bearish sentiment.
Confirm Price Action:
The Volume Delta can be used alongside price action to confirm the strength of a price move. For example, if the price is moving up and the volume delta is positive, it suggests that the price increase is supported by buying pressure.
Identify Divergences:
Volume delta can help traders spot divergences between price and volume. For example, if the price is moving higher but the volume delta is negative, it may suggest a weakening trend and a potential reversal.
Optimize Entry/Exit Points:
By understanding the relationship between price movement and volume, traders can make more informed decisions about entering or exiting positions. For instance, a sudden increase in buying volume (positive delta) may indicate a good entry point for a long position.
Overall, the Volume Delta Dashboard can serve as a powerful tool for improving decision-making, by providing real-time insights into market dynamics and trading sentiment.

CVD Divergence Insights📘 CVD Divergence Insights – by Colicoid
Pine Script v6 | Volume Delta Divergence Oscillator with Spike Detection
⸻
🔍 Overview
CVD Divergence Insights is a volume-aware oscillator and divergence spike detector that helps you spot smart money activity, absorption, failed pressure, and hidden strength or weakness — even when price action alone gives little away.
It works by comparing normalized Cumulative Volume Delta (CVD) against normalized price movement, and optionally applying a volume-weighting layer to highlight when aggressive participation is truly behind the divergence. The result is a dynamic visual tool that identifies tension in the market, and helps you trade based on how that tension resolves.
⸻
🧠 Core Concept
• When price moves one way and CVD moves another, it reflects imbalance between aggression and result.
• Divergence is not a trigger — it’s a build-up of pressure.
• The real edge lies in the resolution of that pressure.
• Optional volume-weighting helps you ignore noise and focus on high-conviction moves only.
⸻
⚙️ How It Works
1. CVD Calculation
CVD is generated using lower-timeframe delta volume (buy vs. sell pressure), accumulated per bar.
2. Oscillator
A normalized divergence between the smoothed CVD and smoothed price.
3. Volume Weighting (optional)
Emphasizes divergences occurring on higher-than-normal volume, deprioritizes low-volume noise.
4. Signal Line (optional)
A short EMA of the oscillator to help track momentum shifts (hidden by default).
5. Divergence Spikes
Statistical spike detection using standard deviation — green/red dots highlight unusually large divergence activity.
⸻
🎛️ Inputs
Anchor Period
Higher timeframe where the CVD is accumulated and processed.
Lower Timeframe
Optional override for granularity of buy/sell volume data.
SMA Length
Used for smoothing both price and CVD before divergence is calculated.
Volume Weighted?
Enables adaptive weighting based on relative volume size.
Volume Normalization Length
Lookback period used to define what is “normal” volume.
Divergence Spike Threshold
StdDev-based threshold to detect abnormally large divergences.
Signal Line Length
Controls the EMA smoothing of the optional signal line (hidden by default).
⸻
📈 Trade Setup Example: Hidden Bullish Divergence
1. Price forms a higher low, but CVD forms a lower low — hidden bullish divergence.
2. This shows aggressive sellers are trying, but price is resilient — likely absorption.
3. You wait for a "convergent signal bar":
• A bullish candle with strong structure or body
• Confirmed by CVD starting to turn upward
4. That’s your trigger bar — the tension resolves upward.
⸻
🤝 Recommended Pairings
For best results, combine CVD Divergence Insights with the companion script:
🔗 Cumulative Volume Delta Line (also by Colicoid)
This lets you:
• See the raw CVD line and its SMA visually
• Spot standard and hidden divergences in price/CVD directly
• Use the Insights indicator to evaluate divergence quality and flag aggressive bull/bear behavior
• Use the same SMA length on both indicators for alignment
👉 Tip: To save screen space, drag the CVD Line indicator into the same panel as CVD Divergence Insights.
⸻
🧰 Why Use This?
• ✅ Catch absorption setups and failed pressure zones
• ✅ Filter out low-quality divergences using volume context
• ✅ Understand why price is hesitating or breaking out
• ✅ Add smart confirmation to breakout/reversal trades
• ✅ Align your execution with who’s actually in control
⸻
📎 Created by Colicoid
Built in Pine Script v6 for advanced price-volume analysis, with focus on effort vs result, market psychology, and smart money detection.
