OPEN-SOURCE SCRIPT
已更新 MUJBOT - Multi-TF RSI Table
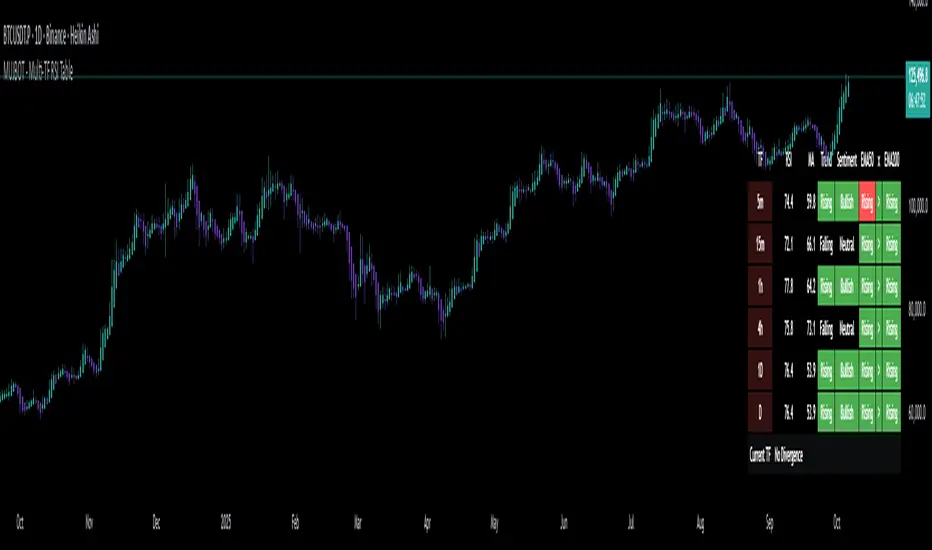
The "Multi-TF RSI Table" indicator is a comprehensive tool designed to present traders with a quick visual summary of the Relative Strength Index (RSI) across multiple timeframes, all within a single glance. It is crafted for traders who incorporate multi-timeframe analysis into their trading strategy, aiming to enhance decision-making by identifying overall market sentiment and trend direction. Here's a rundown of its features:
User Inputs: The indicator includes customizable inputs for the RSI and Moving Average (MA) lengths, allowing users to tailor the calculations to their specific trading needs. Additionally, there is an option to display or hide the RSI & MA table as well as to position it in various places on the chart for optimal visibility.
Multi-Timeframe RSI & MA Calculations: It fetches RSI and MA values from different timeframes, such as 1 minute (1m), 5 minutes (5m), 15 minutes (15m), 1 hour (1h), 4 hours (4h), and 1 day (1D). This multi-timeframe approach provides a thorough perspective of the momentum and trend across different market phases.
Trend and Sentiment Analysis: For each timeframe, the script determines whether the average RSI is above or below the MA, categorizing the trend as "Rising", "Falling", or "Neutral". Moreover, it infers market sentiment as "Bullish" or "Bearish", based on the relationship between the RSI and its MA.
Dynamic Color-Coding: The indicator uses color-coding to convey information quickly. It highlights the trend and sentiment cells in the table with green for "Bullish" and red for "Bearish" conditions. It also shades the timeframe cells based on the RSI value, with varying intensities of green for "Oversold" conditions and red for "Overbought" conditions, providing an immediate visual cue of extreme market conditions.
Customization and Adaptability: The script is designed with customization in mind, enabling users to adjust the RSI and MA lengths according to their trading strategy. Its adaptable interface, which offers the option to display or hide the RSI & MA table, ensures that the tool fits into different trading setups without cluttering the chart.
Ease of Use: By consolidating critical information into a simple table, the "Multi-TF RSI Table" indicator saves time and simplifies the analysis process for traders. It eliminates the need to switch between multiple charts or timeframes, thus streamlining the trading workflow.
In essence, the "Multi-TF RSI Table" is a powerful indicator for Pine Script users on TradingView, offering a multi-dimensional view of market dynamics. It is ideal for both novice and experienced traders who seek to enhance their technical analysis with an at-a-glance summary of RSI trends and market sentiment across various timeframes.
發行說明
Divergence value on current time frame added.
發行說明
Table size options added.發行說明
EMA filter added.
發行說明
version name update發行說明
Better reading. Trend added.
發行說明
Tiny size added.發行說明
Fixed syntax errors: Removed invalid 'b' in RSI calculation and replaced 'syminfo.timeframe' with 'timeframe.period' to resolve "Undeclared identifier" errors.Ensured table consistency: Used 'request.security()' with 'timeframe.period' for the "Current" timeframe to make table values consistent across chart timeframes.
Removed 1m timeframe and divergence row: Excluded 1m from the table and removed the current divergence row, leaving 5m, 15m, 1h, 4h, 1D, and Current timeframes.
發行說明
Fixed getRsiData function: Resolved issues with single-value vs. series handling; now fetches RSI, MA (using user-selected type, not hardcoded SMA), and avgRsi correctly by computing avgRsi as SMA of last 5 RSI values within the security context.Optimized security requests: Reduced from 133+ to just 6 total (one per timeframe via tuple-returning getAllData function) to stay under Pine Script's 40-limit; removed 1m row for efficiency.
Improved EMA trend calculation: Simplified to compare current EMA value against the previous bar (ema > ema[1]) instead of array-based avg of last 5, avoiding shared state issues across timeframes.
Enhanced table management: Added proper parameters to table.clear(infoTable, 0, 0, 7, 7) to fix compilation error; cleared only on last bar for performance; adjusted table to 8 rows (header + 5 TFs + current + divergence).
Refined RSI color logic: Made neutral RSI (30-70) use gray background for better visibility; streamlined ternary conditions for oversold/overbought colors.
Updated divergence row: Consolidated text into one cell, used a for-loop to fill empty cells consistently; improved color assignment based on divergence type.
General cleanup: Ensured all MA types work via ma() function; added barstate.islast checks for table updates; fixed minor syntax like timeframe.period in row label.
開源腳本
秉持TradingView一貫精神,這個腳本的創作者將其設為開源,以便交易者檢視並驗證其功能。向作者致敬!您可以免費使用此腳本,但請注意,重新發佈代碼需遵守我們的社群規範。
免責聲明
這些資訊和出版物並非旨在提供,也不構成TradingView提供或認可的任何形式的財務、投資、交易或其他類型的建議或推薦。請閱讀使用條款以了解更多資訊。
開源腳本
秉持TradingView一貫精神,這個腳本的創作者將其設為開源,以便交易者檢視並驗證其功能。向作者致敬!您可以免費使用此腳本,但請注意,重新發佈代碼需遵守我們的社群規範。
免責聲明
這些資訊和出版物並非旨在提供,也不構成TradingView提供或認可的任何形式的財務、投資、交易或其他類型的建議或推薦。請閱讀使用條款以了解更多資訊。