OPEN-SOURCE SCRIPT
已更新 Ichimoku Score Indicator [tanayroy]

The Ichimoku Cloud is a comprehensive indicator that provides a clear view of market states through five key components. By analyzing the interaction between these components and the asset's price, traders can gain insights into trend direction, momentum, and potential reversals.
Introducing the Ichimoku Score System
I have developed a scoring system that quantifies these interactions, offering an objective method to evaluate market conditions. The score is calculated based on the relative positioning of Ichimoku components, with adjustable weightings via user input.
Scoring Criteria
Each component contributes to the overall score as follows:
Price vs. Cloud (Kumo) & Other Components
Tenkan vs. Kijun
Chikou Span Interactions
Senkou Span Analysis
Price vs. Key Levels
Interpreting the Score
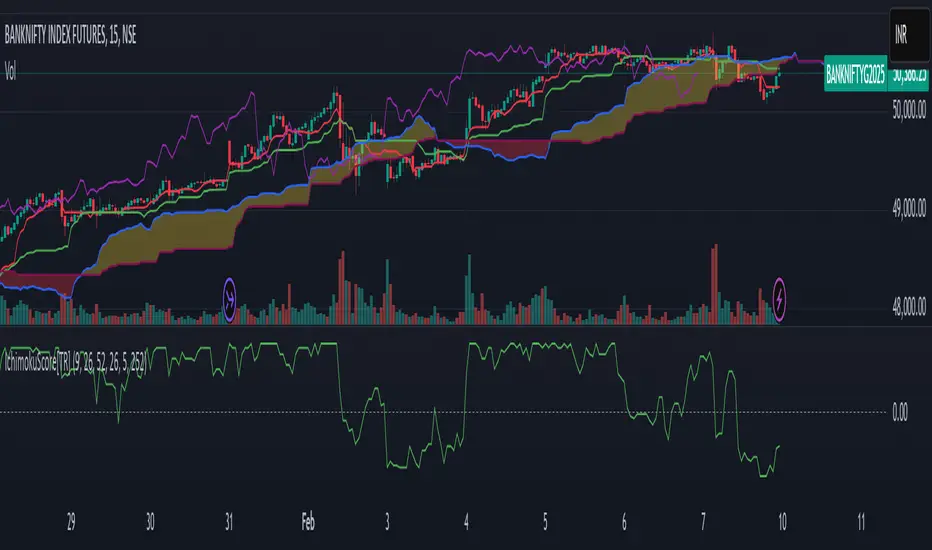
The aggregate score functions as an oscillator, fluctuating between a range of ±16.0.
To enhance readability and smooth fluctuations, a 9-period SMA is applied to the score.
Application in Algorithmic Trading
This scoring system helps integrate Ichimoku Cloud principles into algorithmic trading strategies by providing a structured and quantifiable method for assessing market conditions.
Would love to hear your feedback! 🚀 Let me know how this system works for you.
Introducing the Ichimoku Score System
I have developed a scoring system that quantifies these interactions, offering an objective method to evaluate market conditions. The score is calculated based on the relative positioning of Ichimoku components, with adjustable weightings via user input.
Scoring Criteria
Each component contributes to the overall score as follows:
Price vs. Cloud (Kumo) & Other Components
- Price vs. Kumo → 2 Points
- Price vs. Kumo Shadow → 0.5 Points
Tenkan vs. Kijun
- Tenkan vs. Kijun → 2 Points
- Tenkan vs. Kumo → 0.5 Points
- Kijun vs. Kumo → 0.5 Points
- Tenkan Slope → 0.5 Points
- Kijun Slope → 0.5 Points
Chikou Span Interactions
- Price vs. Chikou → 2 Points
- Chikou vs. Kumo → 0.5 Points
- Chikou Consolidation → 0.5 Points
Senkou Span Analysis
- Senkou A vs. Senkou B → 2 Points
- Senkou Slope → 0.5 Points
Price vs. Key Levels
- Price vs. Tenkan → 2 Points
- Price vs. Kijun → 2 Points
Interpreting the Score
The aggregate score functions as an oscillator, fluctuating between a range of ±16.0.
- A higher score indicates strong bullish momentum.
- A lower score suggests bearish market conditions.
To enhance readability and smooth fluctuations, a 9-period SMA is applied to the score.
Application in Algorithmic Trading
This scoring system helps integrate Ichimoku Cloud principles into algorithmic trading strategies by providing a structured and quantifiable method for assessing market conditions.
Would love to hear your feedback! 🚀 Let me know how this system works for you.
發行說明
Major Bug fixes.開源腳本
秉持TradingView一貫精神,這個腳本的創作者將其設為開源,以便交易者檢視並驗證其功能。向作者致敬!您可以免費使用此腳本,但請注意,重新發佈代碼需遵守我們的社群規範。
免責聲明
這些資訊和出版物並非旨在提供,也不構成TradingView提供或認可的任何形式的財務、投資、交易或其他類型的建議或推薦。請閱讀使用條款以了解更多資訊。
開源腳本
秉持TradingView一貫精神,這個腳本的創作者將其設為開源,以便交易者檢視並驗證其功能。向作者致敬!您可以免費使用此腳本,但請注意,重新發佈代碼需遵守我們的社群規範。
免責聲明
這些資訊和出版物並非旨在提供,也不構成TradingView提供或認可的任何形式的財務、投資、交易或其他類型的建議或推薦。請閱讀使用條款以了解更多資訊。