OPEN-SOURCE SCRIPT
Max Trend Points [BigBeluga]
🔵 OVERVIEW
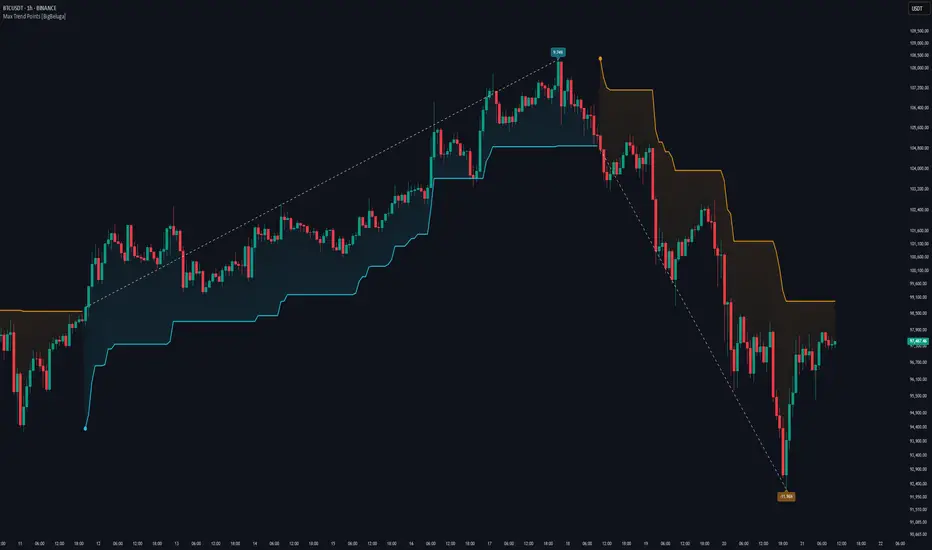
A clean and powerful tool for identifying major trend shifts and quantifying the strength of each move using dynamically calculated price extremes.
This indicator helps traders visualize the most significant trend changes by plotting trend direction lines and dynamically tracking the highest or lowest point within each trend leg. It’s ideal for identifying key price impulses and measuring their magnitude in real time.
🔵 CONCEPTS
🔵 FEATURES
🔵 HOW TO USE
🔵 CONCLUSION
Max Trend Points [BigBeluga] is an efficient visual indicator for understanding the structure and magnitude of trending moves. It provides essential feedback on how far a trend has traveled, where momentum may be peaking, and when a shift may be underway—all with real-time adaptability and clean presentation.
A clean and powerful tool for identifying major trend shifts and quantifying the strength of each move using dynamically calculated price extremes.
This indicator helps traders visualize the most significant trend changes by plotting trend direction lines and dynamically tracking the highest or lowest point within each trend leg. It’s ideal for identifying key price impulses and measuring their magnitude in real time.
🔵 CONCEPTS
- Uses an adaptive trend-following logic based on volatility envelopes created from HMA of the price range (high - low).
- Identifies trend direction and flips when price breaks above or below these dynamic envelopes.
- Tracks swing highs and lows within the current trend leg to highlight trend extremes.
- Calculates and displays the percentage gain or drop from trend start to trend peak/valley.
🔵 FEATURES
- Trend Shift Detection:
Plots a colored trend line (uptrend or downtrend) that updates based on price action volatility. - Impulse Mapping:
Draws a dashed line between the point of trend change (close) and the current trend leg's extreme (highest high or lowest low). - Percentage Labeling:
Displays a floating label showing the exact percent change from the trend start to the current extreme. - Real-Time Adjustments:
As the trend progresses, the extreme point and the percent label update automatically to reflect new highs/lows.
🔵 HOW TO USE
- Look for the trend color shift and circular marker to identify a new potential trend direction.
- Use the dashed lines and percent label to evaluate the strength and potential maturity of each move.
- Combine this tool with support/resistance levels or other indicators to identify confluence zones.
- Adjust the "Factor" input to make the trend detection more or less sensitive depending on your timeframe.
🔵 CONCLUSION
Max Trend Points [BigBeluga] is an efficient visual indicator for understanding the structure and magnitude of trending moves. It provides essential feedback on how far a trend has traveled, where momentum may be peaking, and when a shift may be underway—all with real-time adaptability and clean presentation.
開源腳本
秉持TradingView一貫精神,這個腳本的創作者將其設為開源,以便交易者檢視並驗證其功能。向作者致敬!您可以免費使用此腳本,但請注意,重新發佈代碼需遵守我們的社群規範。
🔵Gain access to our powerful tools : bigbeluga.com/tv
🔵Join our free discord for updates : bigbeluga.com/discord
All scripts & content provided by BigBeluga are for informational & educational purposes only.
🔵Join our free discord for updates : bigbeluga.com/discord
All scripts & content provided by BigBeluga are for informational & educational purposes only.
免責聲明
這些資訊和出版物並非旨在提供,也不構成TradingView提供或認可的任何形式的財務、投資、交易或其他類型的建議或推薦。請閱讀使用條款以了解更多資訊。