OPEN-SOURCE SCRIPT
Low Price RSI Crossover
This Pine Script indicator is a Multi-Timeframe Low RSI Crossover system that combines three key filtering criteria to identify high-probability buy signals. Here's what it does:
Core Concept
The indicator only generates buy signals when all three conditions are met simultaneously:
Price at Multi-Period Low: Current price must be at or near the lowest point within your selected timeframe (1 week to 5 years, or custom)
RSI Momentum Shift: The smoothed RSI must cross above its signal line (EMA), indicating upward momentum
Below Threshold Entry: Both the RSI and its signal line must be below your threshold level (default 50) when the crossover occurs
Key Features
RSI Smoothing: Uses Hull Moving Average (HMA) to smooth the raw RSI, reducing noise and false signals while maintaining responsiveness.
Flexible Timeframes: Choose from predefined periods (1W, 2W, 3W, 1M, 2M, 3M, 6M, 9M, 1Y, 2Y, 3Y, 5Y) or set a custom number of bars.
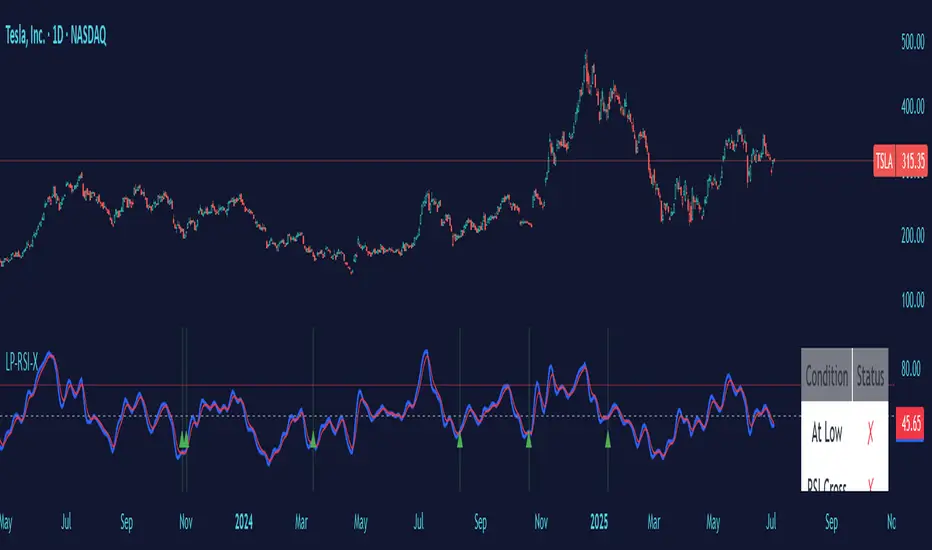
Visual Feedback:
Plots the smoothed RSI (blue line) and its signal line (red line)
Shows threshold and overbought levels
Highlights signal bars with green background
Displays tiny green triangles at signal points
Real-time status table showing all conditions
Trading Logic
This is essentially a mean-reversion strategy that waits for:
Price to reach significant lows (value zone)
Momentum to start shifting upward (RSI crossover)
Entry from oversold/neutral territory (below 50 RSI)
Why This Works
By requiring price to be at multi-period lows, you avoid buying during downtrends or sideways chop. The RSI crossover confirms that selling pressure is starting to ease, while the threshold filter ensures you're not buying into overbought conditions.
The combination of these filters should significantly reduce false signals compared to using any single indicator alone.
Core Concept
The indicator only generates buy signals when all three conditions are met simultaneously:
Price at Multi-Period Low: Current price must be at or near the lowest point within your selected timeframe (1 week to 5 years, or custom)
RSI Momentum Shift: The smoothed RSI must cross above its signal line (EMA), indicating upward momentum
Below Threshold Entry: Both the RSI and its signal line must be below your threshold level (default 50) when the crossover occurs
Key Features
RSI Smoothing: Uses Hull Moving Average (HMA) to smooth the raw RSI, reducing noise and false signals while maintaining responsiveness.
Flexible Timeframes: Choose from predefined periods (1W, 2W, 3W, 1M, 2M, 3M, 6M, 9M, 1Y, 2Y, 3Y, 5Y) or set a custom number of bars.
Visual Feedback:
Plots the smoothed RSI (blue line) and its signal line (red line)
Shows threshold and overbought levels
Highlights signal bars with green background
Displays tiny green triangles at signal points
Real-time status table showing all conditions
Trading Logic
This is essentially a mean-reversion strategy that waits for:
Price to reach significant lows (value zone)
Momentum to start shifting upward (RSI crossover)
Entry from oversold/neutral territory (below 50 RSI)
Why This Works
By requiring price to be at multi-period lows, you avoid buying during downtrends or sideways chop. The RSI crossover confirms that selling pressure is starting to ease, while the threshold filter ensures you're not buying into overbought conditions.
The combination of these filters should significantly reduce false signals compared to using any single indicator alone.
開源腳本
秉持TradingView一貫精神,這個腳本的創作者將其設為開源,以便交易者檢視並驗證其功能。向作者致敬!您可以免費使用此腳本,但請注意,重新發佈代碼需遵守我們的社群規範。
免責聲明
這些資訊和出版物並非旨在提供,也不構成TradingView提供或認可的任何形式的財務、投資、交易或其他類型的建議或推薦。請閱讀使用條款以了解更多資訊。
開源腳本
秉持TradingView一貫精神,這個腳本的創作者將其設為開源,以便交易者檢視並驗證其功能。向作者致敬!您可以免費使用此腳本,但請注意,重新發佈代碼需遵守我們的社群規範。
免責聲明
這些資訊和出版物並非旨在提供,也不構成TradingView提供或認可的任何形式的財務、投資、交易或其他類型的建議或推薦。請閱讀使用條款以了解更多資訊。