INVITE-ONLY SCRIPT
The 11 moving averages with bar color
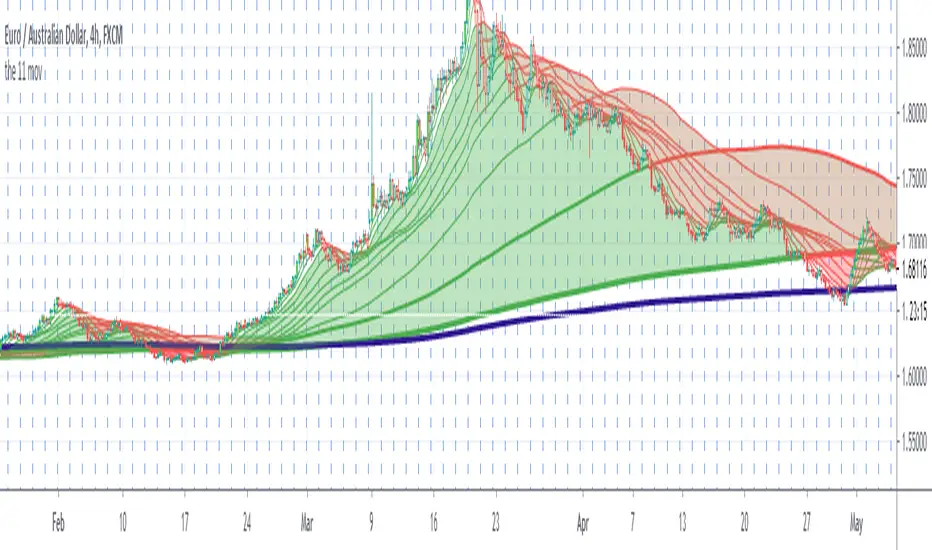
The moving averages change color becoming green or red if there is a bullish trend in green or a bearish trend in red.
There are few ways to use this indicator.These two is what I found easier, please back test it and share your thoughts.
1. When the cloud is red and the candle is outside the cloud and the candle become red it s a sell entry.
When the cloud is green and the candle is outside the cloud and become green it s a buy entry.
2.The moving averages can be used as dynamic support and resistance.In a red cloud if a candle stop exactly where there is a moving averages and the next candle is a bearish engulfing candle it s a sell entry.
In a green cloud if a candle stop exactly where there is a moving averages and the next candle is a bullish engulfing candle it s a buy entry.
The exit is when the bar is not colored anymore or if the bar close below/above the second moving average from the top/from the bottom
Please look as well the blue moving averages that could work as dynamic support/resistance
VERY IMPORTANT WHEN YOU TRY A NEW STRATEGY TEST IT IN A DEMO ACCOUNT FOR AT LEAST 3 MONTHS
Every donations will be devolved to cancer research and you ll have one month free trial.
If you want to purchase this indicator 30% will be devolved to cancer research.
Please leave a comment or message me if you want you have two weeks trial.
Enjoy!
To have access for our 2 week Trial of our indicator please contact us at support@itakepips.com
As well you can have access in our website itakepips.com/
youtube.com/channel/UCupP8hWmM9dIZAXtc_ZVCOg
As well you can have access in our website itakepips.com/
youtube.com/channel/UCupP8hWmM9dIZAXtc_ZVCOg
免責聲明
這些資訊和出版物並非旨在提供,也不構成TradingView提供或認可的任何形式的財務、投資、交易或其他類型的建議或推薦。請閱讀使用條款以了解更多資訊。