OPEN-SOURCE SCRIPT
已更新 [blackcat] L2 Ehlers Sine Wave Indicator
Level: 2
Background
John F. Ehlers introuced Sine Wave Indicator in his "Rocket Science for Traders" chapter 9.
Function
blackcat L2 Ehlers Sine Wave Indicator compared to conventional oscillators such as the Stochastic or Relative Strength Indicator (RSI), the Sinewave Indicator has two major advantages. These are
1. The Sinewave Indicator anticipates the Cycle Mode turning point rather than waiting for confirmation.
2. The phase does not advance when the market is in a Trend Mode. Therefore, the Sinewave Indicator tends to not give false whipsaw signals when the market is in a Trend Mode.
An additional advantage is that the anticipation signal is obtained strictly by mathematically advancing the phase. Momentum is not employed. Therefore, the Sinewave Indicator signals are no more noisy than the original signal.
Key Signal
Smooth --> 4 bar WMA w/ 1 bar lag
Detrender --> The amplitude response of a minimum-length HT can be improved by adjusting the filter coefficients by
trial and error. HT does not allow DC component at zero frequency for transformation. So, Detrender is used to remove DC component/ trend component.
Q1 --> Quadrature phase signal
I1 --> In-phase signal
Period --> Dominant Cycle in bars
SmoothPeriod --> Period with complex averaging
DCPhase ---> dominant cycle phase for sine wave
Pros and Cons
100% John F. Ehlers definition translation of original work, even variable names are the same. This help readers who would like to use pine to read his book. If you had read his works, then you will be quite familiar with my code style.
Remarks
The 8th script for Blackcat1402 John F. Ehlers Week publication.
Readme
In real life, I am a prolific inventor. I have successfully applied for more than 60 international and regional patents in the past 12 years. But in the past two years or so, I have tried to transfer my creativity to the development of trading strategies. Tradingview is the ideal platform for me. I am selecting and contributing some of the hundreds of scripts to publish in Tradingview community. Welcome everyone to interact with me to discuss these interesting pine scripts.
The scripts posted are categorized into 5 levels according to my efforts or manhours put into these works.
Level 1 : interesting script snippets or distinctive improvement from classic indicators or strategy. Level 1 scripts can usually appear in more complex indicators as a function module or element.
Level 2 : composite indicator/strategy. By selecting or combining several independent or dependent functions or sub indicators in proper way, the composite script exhibits a resonance phenomenon which can filter out noise or fake trading signal to enhance trading confidence level.
Level 3 : comprehensive indicator/strategy. They are simple trading systems based on my strategies. They are commonly containing several or all of entry signal, close signal, stop loss, take profit, re-entry, risk management, and position sizing techniques. Even some interesting fundamental and mass psychological aspects are incorporated.
Level 4 : script snippets or functions that do not disclose source code. Interesting element that can reveal market laws and work as raw material for indicators and strategies. If you find Level 1~2 scripts are helpful, Level 4 is a private version that took me far more efforts to develop.
Level 5 : indicator/strategy that do not disclose source code. private version of Level 3 script with my accumulated script processing skills or a large number of custom functions. I had a private function library built in past two years. Level 5 scripts use many of them to achieve private trading strategy.
發行說明
based on important reminding from @sal157011i corrected the errors in original books and now sinewave indicator look much better :D
the new corrections in this update are:
change origintal script to grammar as below:
....... RealPart = RealPart + Sine(360*count/DCPeriod)*(SmoothPrice(count));
....... ImagPart = ImagPart + Cosine(360*count/DCPeriod)*(SmoothPrice(count);
....... If AbsValue(ImagPart) > 0 then DCPhase = Arctangent(RealPart/ImagPart);
....... If AbsValue(ImagPart) <= .001 then DCPhase = DCPhase + 90*Sign(RealPart):
發行說明
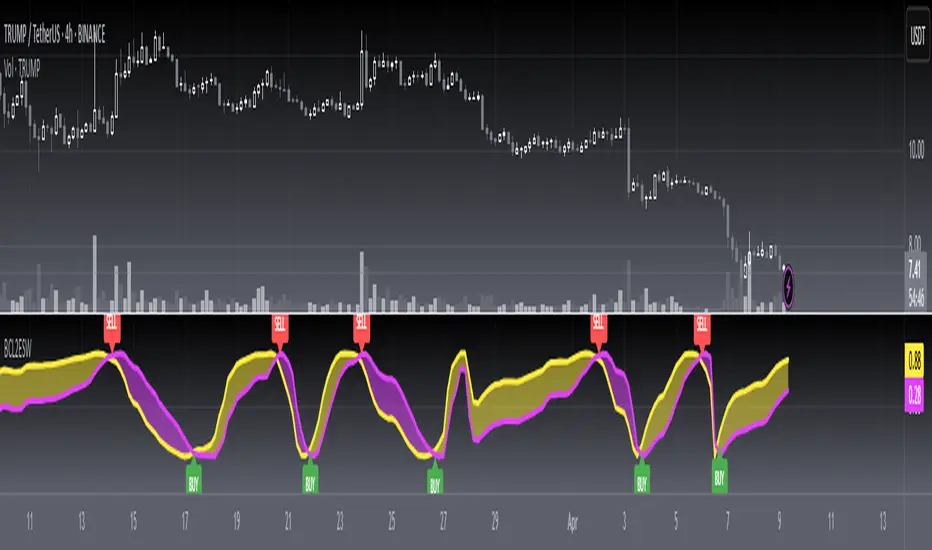
1. Add buy and sell labels2. sine wave indicator is inverse with price trend as claimed by Dr. Ehlers
發行說明
Correct label bar_index issue發行說明
OVERVIEWThis script calculates and visualizes the Ehlers Sine Wave Indicator using a combination of Hilbert Transform and Homodyne Discriminator techniques. It plots the Lead Sine Wave and Sine Wave on the chart and fills the area between them based on their relative positions.
FEATURES
Ehlers Sine Wave Indicator: Calculates the sine wave using advanced filtering techniques.
Plotting: Displays the Lead Sine Wave and Sine Wave with distinct colors.
Cross Labels: Adds buy/sell labels when the Lead Sine Wave crosses above or below the Sine Wave.
HOW TO USE
Add the script to your TradingView chart.
Adjust the "Source" input to select the price data you want to analyze.
Observe the Lead Sine Wave and Sine Wave plots.
Look for cross labels indicating potential buy or sell signals.
LIMITATIONS
The script may not perform optimally on very short timeframes.
Results can vary based on the input price data.
NOTES
This script is an adaptation of the original [blackcat] L2 Ehlers Sine Wave Indicator.
The indicator is best used for trend analysis and identifying potential reversal points.
開源腳本
秉持TradingView一貫精神,這個腳本的創作者將其設為開源,以便交易者檢視並驗證其功能。向作者致敬!您可以免費使用此腳本,但請注意,重新發佈代碼需遵守我們的社群規範。
Avoid losing contact!Don't miss out! The first and most important thing to do is to join my Discord chat now! Click here to start your adventure: discord.com/invite/ZTGpQJq 防止失联,请立即行动,加入本猫聊天群: discord.com/invite/ZTGpQJq
免責聲明
這些資訊和出版物並非旨在提供,也不構成TradingView提供或認可的任何形式的財務、投資、交易或其他類型的建議或推薦。請閱讀使用條款以了解更多資訊。