OPEN-SOURCE SCRIPT
Trading the Trend

Trading the Trend Indicator by Andrew Abraham (TASC, 1998)
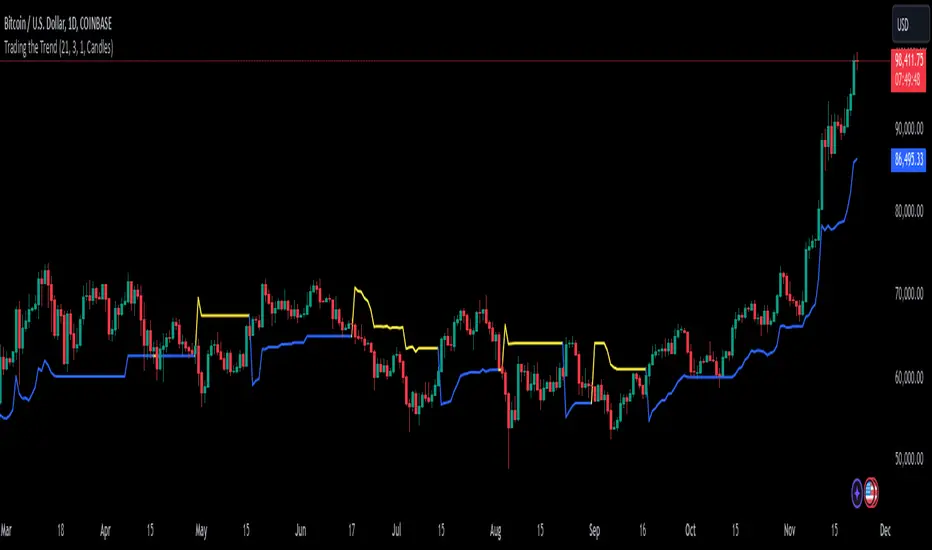
The Trading the Trend indicator, developed by Andrew Abraham, combines volatility and trend-following principles to identify market direction. It uses a 21-period weighted average of the True Range (ATR) to measure volatility and define uptrends and downtrends.
Calculation: The True Range (highest high minus lowest low) is smoothed using a 21-period weighted moving average. This forms the basis for the trend filter, setting dynamic thresholds for trend identification.
Uptrend: Higher highs are confirmed when price stays above the upper threshold, signaling long opportunities.
Downtrend: Lower lows are identified when price stays below the lower threshold, favoring short positions.
This system emphasizes trading only in the direction of the prevailing trend, filtering out market noise and focusing on sustained price movements.
The trendline changes her color. When there is an uptrend the trendline is blue and when the trend is downward the trendline is yellow.
開源腳本
秉持TradingView一貫精神,這個腳本的創作者將其設為開源,以便交易者檢視並驗證其功能。向作者致敬!您可以免費使用此腳本,但請注意,重新發佈代碼需遵守我們的社群規範。
免責聲明
這些資訊和出版物並非旨在提供,也不構成TradingView提供或認可的任何形式的財務、投資、交易或其他類型的建議或推薦。請閱讀使用條款以了解更多資訊。
開源腳本
秉持TradingView一貫精神,這個腳本的創作者將其設為開源,以便交易者檢視並驗證其功能。向作者致敬!您可以免費使用此腳本,但請注意,重新發佈代碼需遵守我們的社群規範。
免責聲明
這些資訊和出版物並非旨在提供,也不構成TradingView提供或認可的任何形式的財務、投資、交易或其他類型的建議或推薦。請閱讀使用條款以了解更多資訊。