OPEN-SOURCE SCRIPT
Volume vs Price Impact Z-Score
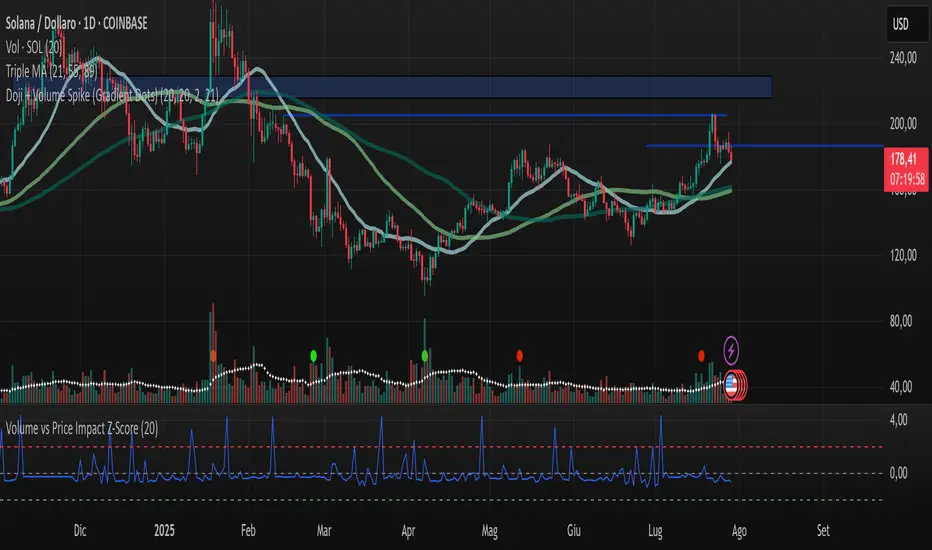
Volume vs Price Impact Z‑Score
This indicator measures how disproportionate the traded volume is relative to the price movement of a candle.
Step 1: Volume-to-Price Impact (VPI)
VPI = Volume / (abs(Close - Open) + ε)
(or optionally using High - Low as the price range)
Step 2: Z‑Score Standardization
Z = (VPI - SMA(VPI, length)) / STDEV(VPI, length)
Interpretation:
Z > 2 → High volume with little price movement → possible absorption (accumulation/distribution).
Z < -2 → Large price move with low volume → weak or illiquid move (potential false breakout).
Use cases:
Detecting accumulation/distribution phases.
Highlighting false breakouts or weak price moves.
Supporting entry/exit decisions based on market efficiency (volume vs. price impact).
開源腳本
秉持TradingView一貫精神,這個腳本的創作者將其設為開源,以便交易者檢視並驗證其功能。向作者致敬!您可以免費使用此腳本,但請注意,重新發佈代碼需遵守我們的社群規範。
免責聲明
這些資訊和出版物並非旨在提供,也不構成TradingView提供或認可的任何形式的財務、投資、交易或其他類型的建議或推薦。請閱讀使用條款以了解更多資訊。
開源腳本
秉持TradingView一貫精神,這個腳本的創作者將其設為開源,以便交易者檢視並驗證其功能。向作者致敬!您可以免費使用此腳本,但請注意,重新發佈代碼需遵守我們的社群規範。
免責聲明
這些資訊和出版物並非旨在提供,也不構成TradingView提供或認可的任何形式的財務、投資、交易或其他類型的建議或推薦。請閱讀使用條款以了解更多資訊。