INVITE-ONLY SCRIPT
已更新 Order + Breaker Blocks HTF
This indicator is a Hidden Liquidity Script, being a much more refined and precise version of "Order Blocks" also known as "Supply and Demand" zones.
This script is more refined and precise as this script is the only script that displays the exact body part of blocks on multiple timeframes, showing potentially powerful price reversal zones for taking a long or short.
This is a PRICE ACTION indicator, demonstrating price action that can result in potential good support/resistance levels for taking a long or short trade.
This indicator only displays the body part of order blocks, instead of including wicks that all other indicators do. That makes this script a much more refined version of all other scripts out there.
Not only that, this script can collate multiple timeframes into one indicator, again something other scripts cannot do.
This script is also unique compared to other Hidden Liquidity style scripts in that you have full control over each Order Block so you can see each individual block on a chart, whilst other charts combine them into a zone instead. This refined version gives you precise potential entries and much further refinement as well as more thorough backtesting capabilities.
This script also can highlight order blocks that pass THROUGH a Fair Value Gap. These are known as 'Breaker Blocks'. These powerful blocks can be places of interest as support or resistance for a long or short trade. Note: This script shows the body part of a block only and not the wick.
Breaker Blocks, where significant displacement has occurred in price past a block can be more powerful. This script does not highlight Fair Value Gaps themselves, only order blocks (supply and demand) and breaker blocks through displacement in price (through an FVG). FVGs on their own can be weaker without order blocks behind them hence they are not highlighted.
The BODY of the order block, and the 0.5 of the order block are key regions for considering a trade, treating that level as either resistance or support.
Important: PLEASE NOTE: This indicator will only show timeframes that are higher than or the same as the current chart timeframe.
For Example, only blocks 3 Days or higher will show on a 3D chart. It will not show 12h blocks on a 3D chart. You would need to go to a 12 hour chart with the 12h blocks showing to see all Blocks that are 12h or higher drawn.
SETTINGS:
There is options to change the colours of the boxes and to differentiate between Order Blocks and stronger Breaker Blocks if desired.
If this is NOT desired, make all color options the same color,.
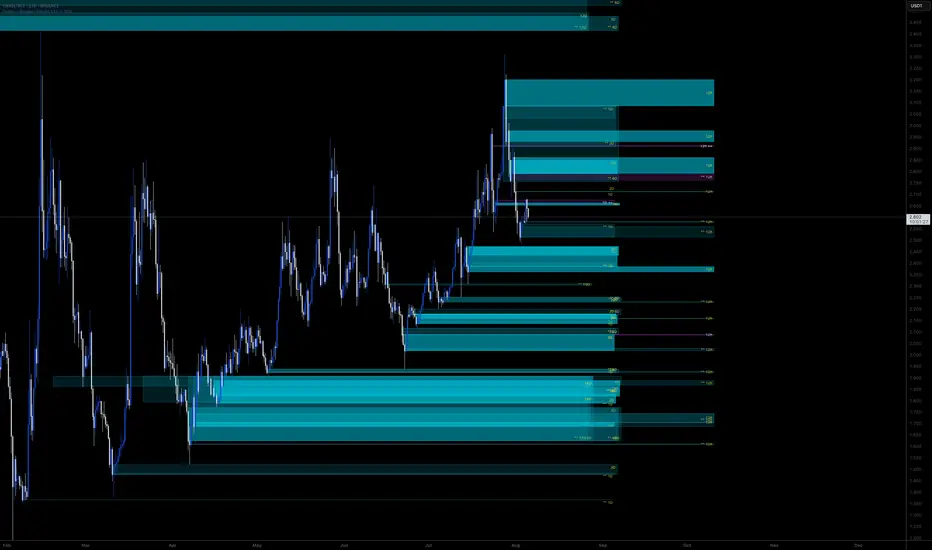
Shown below is blue Order Blocks (Supply and Demand)

Shown below there is Pink Breaker Blocks.

There is options to weaken the colour of blocks that have been tapped by a wick and thus partially used up, also called partially "mitigated".These blocks can be considered weaker support/resistance.
Once a block has had a wick or body close over it entirely, the block can be considered fully "mitigated" and will disappear from the indicator once that candle has closed. This block level can now be considered too weak. You can also choose to not show these partially mitigated blocks at all.


The chart above shows pale Violet blocks as partially mitigated or "tapped" blocks.
The blocks in HOT BRIGHT Violet are untapped and potentially stronger levels for a Long or Short trade.

See below and example of a HOT PINK stronger level with a 1,2,3,4,5 Days of blocks in the one area.

See below an example of a weaker pink level. Still valid, but potentially riskier. There is a weaker 5D Block in pale pink and no other days in that same zone.

Additional SETTINGS:
Further options include, if selected: Counting the number of fair value gaps an order block may pass through. More FVGs an order block (now a breaker block) passes through can strengthen the support of that block level, making a reversal more likely.

There is an option of showing old mitigated order blocks and changing the color of these on the chart. This can aid in backtesting of levels.

Further Settings include:
- an option to remove very thin blocks that may not be strong points.
- an option to denote with a character such as a * blocks that have their EQ 0.5 region wicked - these can be considered weaker.
- an option to denote with an additional * or another character blocks that are barely tapped by a small percent so you know they are still considered quite strong.
- an option to show how many candles form the order block.

Additional Options include:
- an option to show blocks only within a specific price range or percent range of the current price.
- an option to only look X number of bars back.

There is Options regarding labelling, and Border widths on boxes.

It is ESSENTIAL to do your own research and backtesting!
It is recommended to combine these levels with other concepts for added confluence.
Other indicators are NOT included in this script. This is purely a refined order block script for the BODY of a block only.
You can combine Order Blocks and stronger versions known as Breaker Blocks in this script with other indicators or concepts to form a Full Trading Strategy.
Other potential concepts to combine, not shown in this script can include Smart Money Concepts, Market Structure, Fibonnaccis, SMAs, EMAs or any other concept to give added confluence to the support / resistance levels identified in this script that may indicate that the level is stronger.
This indicator is not a trading strategy on its own. It is best used in combination with other concepts to improve the success.
Backtesting this indicator is highly recommended and incorporated into a full trading system of your own design. This only identifies possible key regions based on Price Action Strategies.
This indicator simply makes the identification of these hot levels easier and simpler to find, especially across multiple timeframes.
A strong bright zone on the indicator can be a stronger level than a weak partial block that is in light colours.
Again -Please do your own research and backtesting.
These indicators make finding these levels much much simpler and easier when combined with a full trading strategy. Any feedback is welcome.
This script is more refined and precise as this script is the only script that displays the exact body part of blocks on multiple timeframes, showing potentially powerful price reversal zones for taking a long or short.
This is a PRICE ACTION indicator, demonstrating price action that can result in potential good support/resistance levels for taking a long or short trade.
This indicator only displays the body part of order blocks, instead of including wicks that all other indicators do. That makes this script a much more refined version of all other scripts out there.
Not only that, this script can collate multiple timeframes into one indicator, again something other scripts cannot do.
This script is also unique compared to other Hidden Liquidity style scripts in that you have full control over each Order Block so you can see each individual block on a chart, whilst other charts combine them into a zone instead. This refined version gives you precise potential entries and much further refinement as well as more thorough backtesting capabilities.
This script also can highlight order blocks that pass THROUGH a Fair Value Gap. These are known as 'Breaker Blocks'. These powerful blocks can be places of interest as support or resistance for a long or short trade. Note: This script shows the body part of a block only and not the wick.
Breaker Blocks, where significant displacement has occurred in price past a block can be more powerful. This script does not highlight Fair Value Gaps themselves, only order blocks (supply and demand) and breaker blocks through displacement in price (through an FVG). FVGs on their own can be weaker without order blocks behind them hence they are not highlighted.
The BODY of the order block, and the 0.5 of the order block are key regions for considering a trade, treating that level as either resistance or support.
Important: PLEASE NOTE: This indicator will only show timeframes that are higher than or the same as the current chart timeframe.
For Example, only blocks 3 Days or higher will show on a 3D chart. It will not show 12h blocks on a 3D chart. You would need to go to a 12 hour chart with the 12h blocks showing to see all Blocks that are 12h or higher drawn.
SETTINGS:
There is options to change the colours of the boxes and to differentiate between Order Blocks and stronger Breaker Blocks if desired.
If this is NOT desired, make all color options the same color,.
Shown below is blue Order Blocks (Supply and Demand)
Shown below there is Pink Breaker Blocks.
There is options to weaken the colour of blocks that have been tapped by a wick and thus partially used up, also called partially "mitigated".These blocks can be considered weaker support/resistance.
Once a block has had a wick or body close over it entirely, the block can be considered fully "mitigated" and will disappear from the indicator once that candle has closed. This block level can now be considered too weak. You can also choose to not show these partially mitigated blocks at all.
The chart above shows pale Violet blocks as partially mitigated or "tapped" blocks.
The blocks in HOT BRIGHT Violet are untapped and potentially stronger levels for a Long or Short trade.
See below and example of a HOT PINK stronger level with a 1,2,3,4,5 Days of blocks in the one area.
See below an example of a weaker pink level. Still valid, but potentially riskier. There is a weaker 5D Block in pale pink and no other days in that same zone.
Additional SETTINGS:
Further options include, if selected: Counting the number of fair value gaps an order block may pass through. More FVGs an order block (now a breaker block) passes through can strengthen the support of that block level, making a reversal more likely.
There is an option of showing old mitigated order blocks and changing the color of these on the chart. This can aid in backtesting of levels.
Further Settings include:
- an option to remove very thin blocks that may not be strong points.
- an option to denote with a character such as a * blocks that have their EQ 0.5 region wicked - these can be considered weaker.
- an option to denote with an additional * or another character blocks that are barely tapped by a small percent so you know they are still considered quite strong.
- an option to show how many candles form the order block.
Additional Options include:
- an option to show blocks only within a specific price range or percent range of the current price.
- an option to only look X number of bars back.
There is Options regarding labelling, and Border widths on boxes.
It is ESSENTIAL to do your own research and backtesting!
It is recommended to combine these levels with other concepts for added confluence.
Other indicators are NOT included in this script. This is purely a refined order block script for the BODY of a block only.
You can combine Order Blocks and stronger versions known as Breaker Blocks in this script with other indicators or concepts to form a Full Trading Strategy.
Other potential concepts to combine, not shown in this script can include Smart Money Concepts, Market Structure, Fibonnaccis, SMAs, EMAs or any other concept to give added confluence to the support / resistance levels identified in this script that may indicate that the level is stronger.
This indicator is not a trading strategy on its own. It is best used in combination with other concepts to improve the success.
Backtesting this indicator is highly recommended and incorporated into a full trading system of your own design. This only identifies possible key regions based on Price Action Strategies.
This indicator simply makes the identification of these hot levels easier and simpler to find, especially across multiple timeframes.
A strong bright zone on the indicator can be a stronger level than a weak partial block that is in light colours.
Again -Please do your own research and backtesting.
These indicators make finding these levels much much simpler and easier when combined with a full trading strategy. Any feedback is welcome.
發行說明
Some minor settings updates, one bug fix on displaying partial blocks.發行說明
Updated options發行說明
Reinstated with original script發行說明
Updated Speeds - processes in 1-2 secondsRefinded existing features around fair value gaps and order block widths.
Other updated settings.
發行說明
Updates to restrict number of calls for smaller plansChanged to a HTF Script only 12h, 1D-20D
發行說明
quick fix發行說明
Reduced from 21 to 20 timeframes due to Trading view plan restrictions發行說明
Fixed W/M bugChanged TFs to be more general.
僅限邀請腳本
僅作者批准的使用者才能訪問此腳本。您需要申請並獲得使用許可,通常需在付款後才能取得。更多詳情,請依照作者以下的指示操作,或直接聯絡Sugarglider55。
TradingView不建議在未完全信任作者並了解其運作方式的情況下購買或使用腳本。您也可以在我們的社群腳本中找到免費的開源替代方案。
作者的說明
Contact for access
免責聲明
這些資訊和出版物並非旨在提供,也不構成TradingView提供或認可的任何形式的財務、投資、交易或其他類型的建議或推薦。請閱讀使用條款以了解更多資訊。
僅限邀請腳本
僅作者批准的使用者才能訪問此腳本。您需要申請並獲得使用許可,通常需在付款後才能取得。更多詳情,請依照作者以下的指示操作,或直接聯絡Sugarglider55。
TradingView不建議在未完全信任作者並了解其運作方式的情況下購買或使用腳本。您也可以在我們的社群腳本中找到免費的開源替代方案。
作者的說明
Contact for access
免責聲明
這些資訊和出版物並非旨在提供,也不構成TradingView提供或認可的任何形式的財務、投資、交易或其他類型的建議或推薦。請閱讀使用條款以了解更多資訊。