OPEN-SOURCE SCRIPT
Downside Weekly Reversal
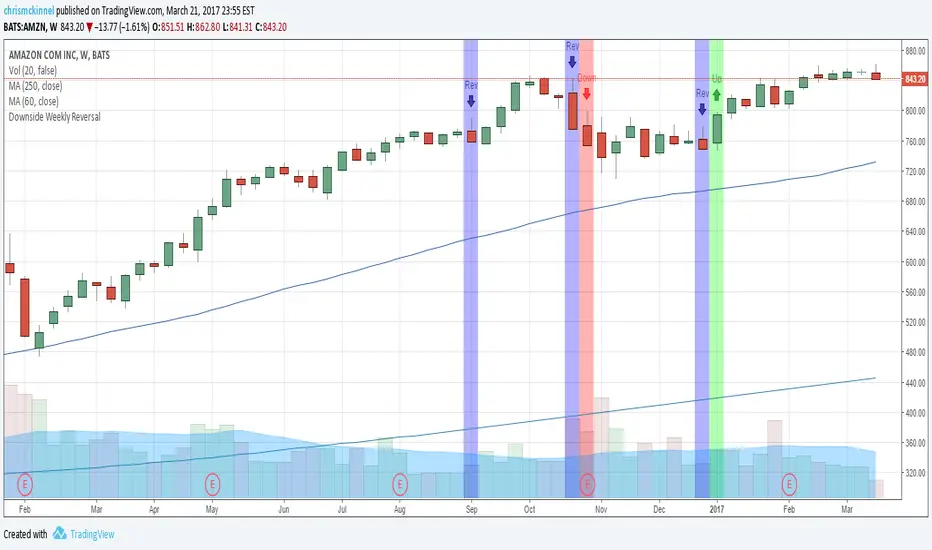
Based on Thomas Bulkowski's top ranking small pattern: the Downside Weekly Reversal pattern.
Add this indicator to your weekly charts.
Blue bars represent weekly reversals and green bars following blue bars indicate an upside breakout. These are to be traded in a Bull market.
Red bars following blue bars indicate a downside breakout. These are to be traded in a Bear market.
More details: thepatternsite.com/WeeklyRevsDownside.html
開源腳本
秉持TradingView一貫精神,這個腳本的創作者將其設為開源,以便交易者檢視並驗證其功能。向作者致敬!您可以免費使用此腳本,但請注意,重新發佈代碼需遵守我們的社群規範。
免責聲明
這些資訊和出版物並非旨在提供,也不構成TradingView提供或認可的任何形式的財務、投資、交易或其他類型的建議或推薦。請閱讀使用條款以了解更多資訊。
開源腳本
秉持TradingView一貫精神,這個腳本的創作者將其設為開源,以便交易者檢視並驗證其功能。向作者致敬!您可以免費使用此腳本,但請注意,重新發佈代碼需遵守我們的社群規範。
免責聲明
這些資訊和出版物並非旨在提供,也不構成TradingView提供或認可的任何形式的財務、投資、交易或其他類型的建議或推薦。請閱讀使用條款以了解更多資訊。