OPEN-SOURCE SCRIPT
Strength Momentum Indicator
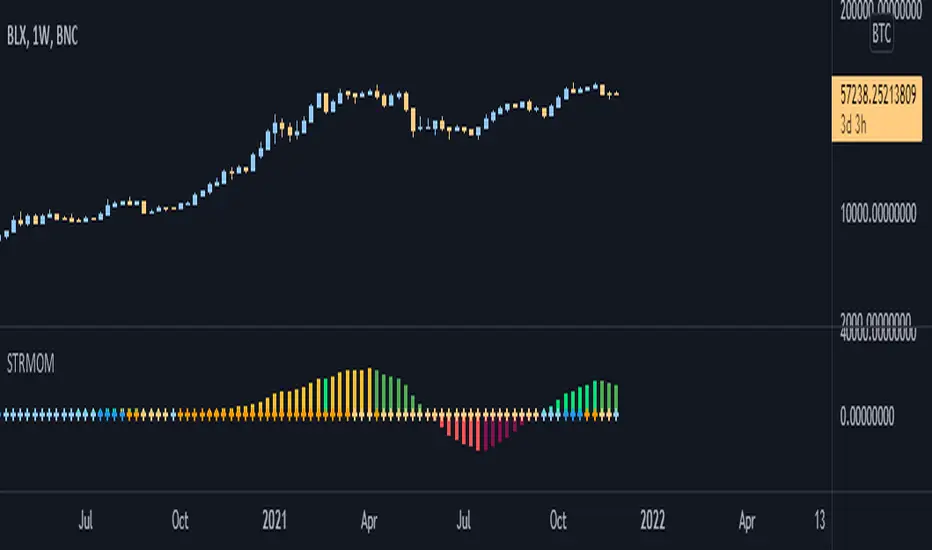
This indicator is a fork of https://www.tradingview.com/script/nqQ1DT5a-Squeeze-Momentum-Indicator-LazyBear/. It takes it a step further by including RSI and ADX information, which are represented in this indicator as follows:
Almost all of the normally adjustable values can be adjusted in the settings for each of the base indicators. Also adjustable:
- MOM: The histogram itself is a linear regression curve, by default for the study period the Fibonacci series and exponential moving average were used. You can adjust the settings to your liking.
- RSI: Whenever the RSI is outside the normal ranges (which you can adjust in the settings), the bar in the histogram will turn amber to warn you.
- ADX: Crosses are drawn along the 0 line to indicate the ADX . Blue means that the ADX is below the trend level (adjustable in the settings), and orange means that it is above that level. Darker colors indicate that the ADX has risen from the previous bar, while lighter colors indicate that it has fallen.
Almost all of the normally adjustable values can be adjusted in the settings for each of the base indicators. Also adjustable:
- The RSI alert levels (30 and 70 by default).
- The ADX crossover, i.e. the point at which the ADX value is considered to indicate a strong trend (25 by default).
- All colors, naturally.
開源腳本
秉持TradingView一貫精神,這個腳本的創作者將其設為開源,以便交易者檢視並驗證其功能。向作者致敬!您可以免費使用此腳本,但請注意,重新發佈代碼需遵守我們的社群規範。
免責聲明
這些資訊和出版物並非旨在提供,也不構成TradingView提供或認可的任何形式的財務、投資、交易或其他類型的建議或推薦。請閱讀使用條款以了解更多資訊。
免責聲明
這些資訊和出版物並非旨在提供,也不構成TradingView提供或認可的任何形式的財務、投資、交易或其他類型的建議或推薦。請閱讀使用條款以了解更多資訊。