PROTECTED SOURCE SCRIPT
Dynamic Pivot Point
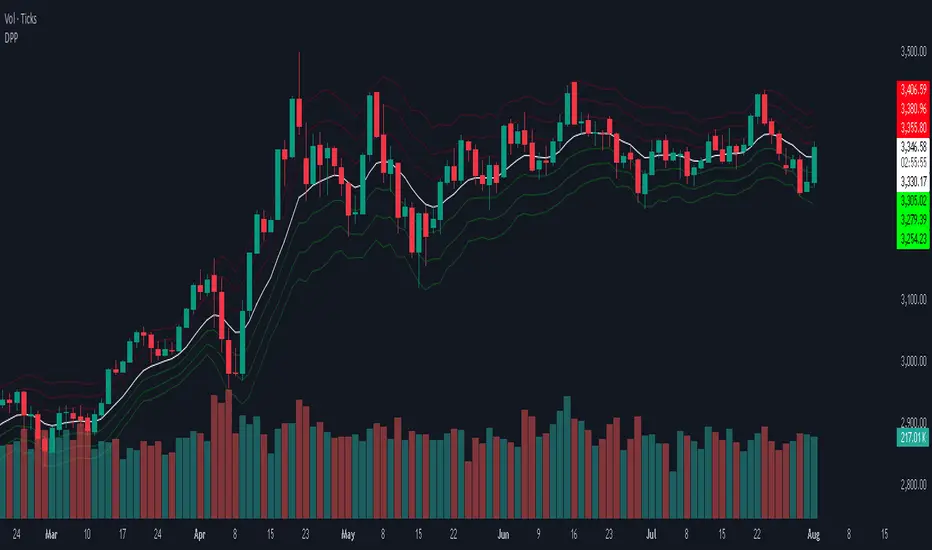
This indicator calculates and displays dynamic pivot points (Pivot, Support, and Resistance levels) based on a selected timeframe. These levels help traders identify potential price reversal zones, support/resistance, and trend direction.
it calculates:
Support Levels (S1, S2, S3)
Resistance Levels (R1, R2, R3)
Dynamic Feature:
a pivot defined period ( default = 5). you can change .
You can choose a specific timeframe (pivotTimeFrame) for calculating pivot levels (e.g., Daily, Weekly, etc.).
Visibility Toggle:
You can turn the pivot levels on or off using the input toggle.
Color Scheme:
Pivot Line: White
Support Levels: Green (S1, S2, S3)
Resistance Levels: Red (R1, R2, R3)
How to Trade With It:
1. Support and Resistance Reversals:
Buy near support levels (S1, S2, S3) if price shows bullish reversal signals.
Sell near resistance levels (R1, R2, R3) if price shows bearish reversal signals.
2. Breakout Trading:
Break above R1/R2/R3 with strong volume may indicate a bullish breakout — consider long positions.
Break below S1/S2/S3 may signal a bearish breakout — consider short positions.
3. Trend Confirmation:
If price stays above Pivot and supports hold — trend is likely bullish.
If price stays below Pivot and resistances hold — trend is likely bearish.
受保護腳本
此腳本以閉源形式發佈。 不過,您可以自由且不受任何限制地使用它 — 在此處了解更多資訊。
免責聲明
這些資訊和出版物並不意味著也不構成TradingView提供或認可的金融、投資、交易或其他類型的意見或建議。請在使用條款閱讀更多資訊。
受保護腳本
此腳本以閉源形式發佈。 不過,您可以自由且不受任何限制地使用它 — 在此處了解更多資訊。
免責聲明
這些資訊和出版物並不意味著也不構成TradingView提供或認可的金融、投資、交易或其他類型的意見或建議。請在使用條款閱讀更多資訊。