OPEN-SOURCE SCRIPT
已更新 R-I-ORB
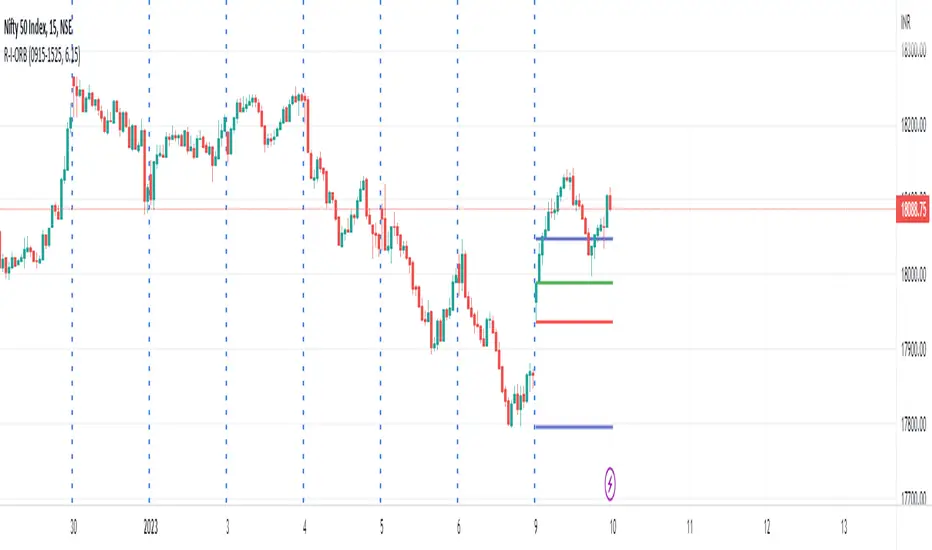
This is an intraday indicator which plots high and low of timeframe's first bar.
Top line - High of the first session bar
Bottom line - low of the first session bar
Requires session timing and total trading hours to plot the lines appropriately.
We can use the indicator to trade intraday opening range breakouts.
Thanks!
Top line - High of the first session bar
Bottom line - low of the first session bar
Requires session timing and total trading hours to plot the lines appropriately.
We can use the indicator to trade intraday opening range breakouts.
Thanks!
發行說明
Update : Color customization by user發行說明
Added new lines,PDH - Previous Day High
PDL - Previous Day Low
Plot Historical lines - Plot ORB, PDH & PDL lines to historical data. This setting is turned off by default. It can be turned on if we need to plot lines on historical bars.
Colors can be changed for PDH & PDL values.
發行說明
Risk Disclosure: This indicator does not provide buy/sell signals and relies on past data, which may not accurately reflect future outcomes. We are not liable for any profits or losses incurred. Please assess and trade at your own risk.開源腳本
秉持TradingView一貫精神,這個腳本的創作者將其設為開源,以便交易者檢視並驗證其功能。向作者致敬!您可以免費使用此腳本,但請注意,重新發佈代碼需遵守我們的社群規範。
免責聲明
這些資訊和出版物並非旨在提供,也不構成TradingView提供或認可的任何形式的財務、投資、交易或其他類型的建議或推薦。請閱讀使用條款以了解更多資訊。
開源腳本
秉持TradingView一貫精神,這個腳本的創作者將其設為開源,以便交易者檢視並驗證其功能。向作者致敬!您可以免費使用此腳本,但請注意,重新發佈代碼需遵守我們的社群規範。
免責聲明
這些資訊和出版物並非旨在提供,也不構成TradingView提供或認可的任何形式的財務、投資、交易或其他類型的建議或推薦。請閱讀使用條款以了解更多資訊。