PROTECTED SOURCE SCRIPT
已更新 Doganayy2 Buy/Sell & liquidityTrap
🔧 User-Changeable Settings and Their Meanings
1. ✅ Is Wick Filter Active?
What does it do?: Controls the length of the candle wick.
Effect: If active, a long wick is considered a trap (a sign of manipulation).
2. 📊 Is Volume Filter Active?
What does it do?: Controls abnormally high volume according to the volume average.
Effect: If active, high volume candles are considered for a liquidity trap signal.
3. 📈 Is RSI Filter Active?
What does it do?: Controls overbought/oversold according to the RSI level.
Effect: If active;
If RSI > ?, a long trap is searched.
If RSI < ?, a short trap is searched.
4. 🔴🟢 Is Candle Color (Direction) Filter Active?
What does it do?: Controls whether the candle is green or red.
Effect: If active;
A red candle (selling pressure) is required for a long trap.
A green candle (buying pressure) is required for a short trap.
5. 🧮 Is Fibonacci Level Filter Active?
What does it do?: Checks whether the price has reached important Fibonacci levels.
Effect: If active;
For a long trap, the price must rise above the Fibo level.
For a short trap, the price must fall below the Fibo level.
6. 📏 Is ATR Filter Active?
What does it do?: Checks whether there is sufficient deviation in the price according to the ATR.
Effect: If active;
A trap signal is given according to whether the price has moved too far from the ATR.
📌 As a result:
As these filters are activated, the system's long/short trap detection becomes tighter and produces fewer but more reliable signals. If you close the filters, you will receive more signals, but reliability may decrease.
Purpose of the indicator: To present buy/sell opportunities by detecting liquidity traps.
發行說明
This indicator identifies liquidity traps (false breakouts) by detecting:Price Rejections at key levels (support/resistance)
Abnormal Volume/Wick Activity
Market Structure Shifts
Key Components
1. Liquidity Trap Detection
Long Trap (Bearish):
Price spikes above resistance but gets rejected (long upper wick)
High volume + Overbought RSI + Bearish candle
Short Trap (Bullish):
Price dips below support but reverses (long lower wick)
High volume + Oversold RSI + Bullish candle
2. Smart Filters (Toggle On/Off)
Wick Filter: Only traps with significant wicks (wickRatio)
Volume Filter: Requires volume spikes (highVolumeMultiplier)
RSI Filter: Confirms overbought/oversold conditions
ATR Filter: Validates moves beyond noise threshold
3. Multi-Asset Confirmation
Analyzes BTC and USDT.D (dollar strength) together:
4. Visual Output
Labels: "BUY/SELL" for high-probability signals
Zones: Dynamic support/resistance with break counters
Background Colors: Highlights signal areas
Why It Works
Targets institutional liquidity grabs where stop hunts occur
Combines price action, volume, and momentum for confirmation
Reduces false signals with multiple filters
Best Use Cases
Crypto (BTC/ETH) and volatile assets
15min-4H timeframes for swing trading
Tip: Start with all filters ON, then customize based on your asset's behavior.
發行說明
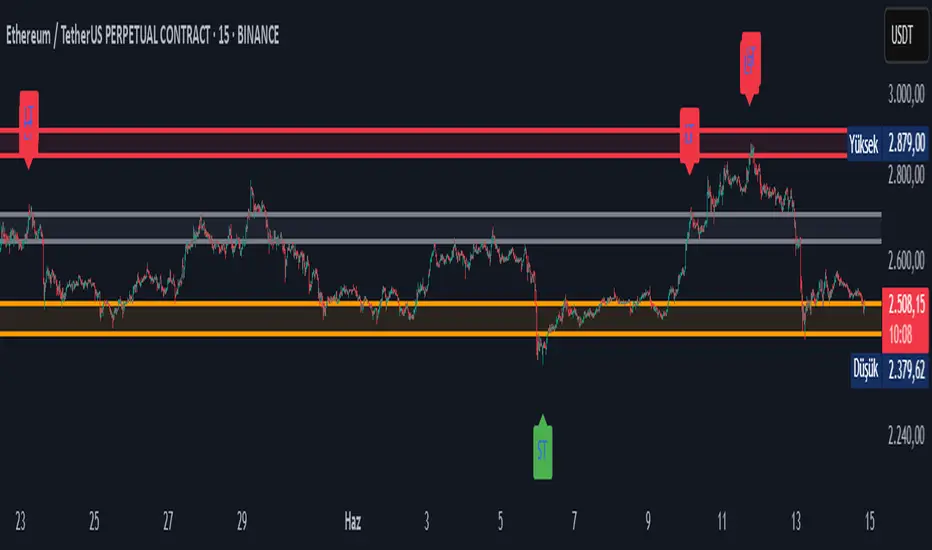
📌 Key FeaturesResistance/Support Liquidity Zones (Colored boxes)
Long/Short Trap Signals (LT/ST labels)
Dynamic Filter System (10+ technical confirmations)
Fibonacci Compatible Analysis
Optimized on 4H/1D timeframes
Customize parameters by clicking on the Settings icon
🎯 How to Use?
1️⃣ Identifying Liquidity Zones
Color Meaning
🔴 Red Resistance Zone (Price may react at this level)
🟢 Green Support Zone (Price may rise at this level)
🟣 Purple Broken Resistance (Can now be support)
🟠 Orange Broken Support (Can now be resistance)
⚪ Gray Equilibrium (Balance) Zone (Area of buy-sell balance)
2️⃣ Signals
Signal Meaning
LT 🚨 Long Trap (Price may fall, alert for short position)
ST 🚀 Short Trap (Price may rise, alert for long position)
3️⃣ Filters (Optional)
Wick Filter → Detects long wick candles
Volume Filter → Catches abnormal volume increases
RSI Filter → Indicates overbought/oversold areas
ATR Filter → Adjusts according to volatility
ADX Filter → Measures trend strength
⚡ Strategy Recommendations
A) Trading with Liquidity Traps
LT (Long Trap) Signal + Red Resistance Box → Open Short Position
ST (Short Trap) Signal + Green Support Box → Open Long Position
B) Breakout Strategy
Purple Box (Broken Resistance) → Use as new support, long hold
Orange Box (Broken Support) → Use as new resistance, short hold
C) Equilibrium (Balance) Zone
If the price is stuck in the gray box → There may be consolidation before the big move.
🔧 Optimization Tips
For BTC/ETH: Liquidity Trap Period = 20, ATR Multiplier = 2.0
For Altcoins: Liquidity Trap Period = 15, Volume Multiplier = 2.5
Works better on 4H/1D timeframes
📢 Warnings
❗ To Reduce False Signal Risk:
Keep at least 3 filters active (Wick, Volume, RSI)
Trade in line with the 1D trend
Confirm LT/ST signals with other indicators (Ex: MACD, VWAP)
💡 Final Advice
This indicator should not be used alone. Definitely combine with:
✅ Price Action (Candlestick formations)
✅ Fundamental Analysis (News, BTC Dominance)
✅ Risk Management (Using stop-loss)
受保護腳本
此腳本以閉源形式發佈。 不過,您可以自由使用,沒有任何限制 — 點擊此處了解更多。
免責聲明
這些資訊和出版物並非旨在提供,也不構成TradingView提供或認可的任何形式的財務、投資、交易或其他類型的建議或推薦。請閱讀使用條款以了解更多資訊。
免責聲明
這些資訊和出版物並非旨在提供,也不構成TradingView提供或認可的任何形式的財務、投資、交易或其他類型的建議或推薦。請閱讀使用條款以了解更多資訊。