INVITE-ONLY SCRIPT
BankNifty Radar @BhupiX
BankNifty Radar
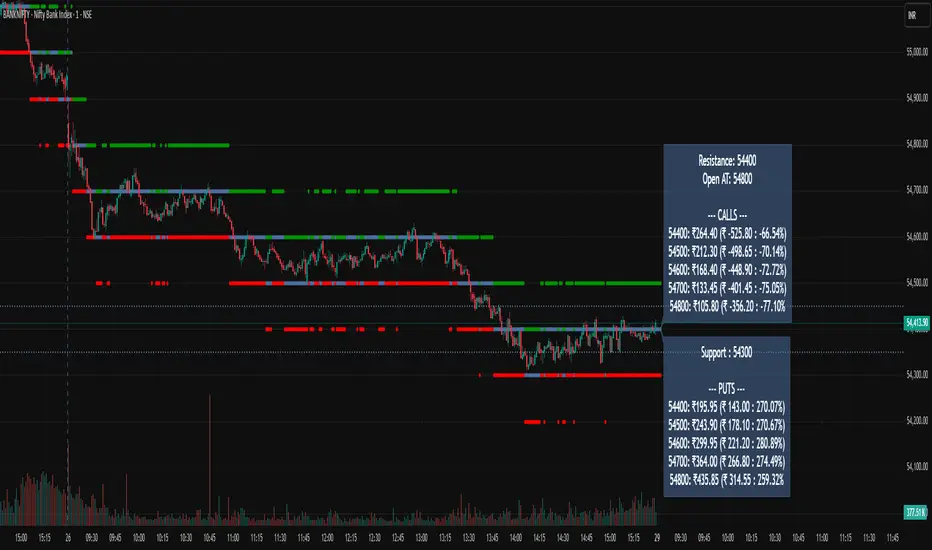
This indicator automatically detects and plots the most important support and resistance zones where markets often show reversal or breakout moves. These levels are based on key price reactions and are highly useful for identifying potential big moves in Index, Futures, and Options Charts.
🔹 Key Features
Auto-detection of major support & resistance levels
Works across Index, Futures & Options Charts
Highlights zones where strong reversal or breakout is likely
Helps traders plan entries, exits, and stop-loss levels
Ideal for intraday as well as positional trading
🔹 How to Use
Use support levels to identify buying opportunities during pullbacks
Use resistance levels to spot selling opportunities or possible breakouts
Combine with volume/momentum indicators for higher accuracy
Options traders can use these levels to select ATM/OTM strikes with better conviction
⚡ This tool is designed to give traders a clear view of where the market is likely to react, making it easier to catch big moves after reversals or breakouts.
This indicator tracks & Draw BankNifty Index & options important support and resistance levels and 10 options Strikes Live prices & Price Change and price change in % in one place.
This Indicator Work Only BankNifty Index ,Futures & Option Strike charts charts.
📌 Financial Disclaimer
This indicator is created for educational and informational purposes only. It does not constitute financial or investment advice. Past performance is not indicative of future results. Trading in stocks, futures, and options involves substantial risk of loss and may not be suitable for all investors. Please consult with your financial advisor before making any trading or investment decisions. Use this indicator at your own risk.
僅限邀請腳本
僅作者批准的使用者才能訪問此腳本。您需要申請並獲得使用許可,通常需在付款後才能取得。更多詳情,請依照作者以下的指示操作,或直接聯絡Bhupix。
TradingView不建議在未完全信任作者並了解其運作方式的情況下購買或使用腳本。您也可以在我們的社群腳本中找到免費的開源替代方案。
作者的說明
📌 This script is part of BhupiX Technical Collections
🔒 Available in Invite-Only mode
👉 For access, kindly send me a DM
📩 Contact details are in my profile Section.
✨ BhupiX Trader
📊 Advanced Indicators & Strategies
📞 wa.me/919718453620 | ✉️ bhupixtrader@gmail.com
📊 Advanced Indicators & Strategies
📞 wa.me/919718453620 | ✉️ bhupixtrader@gmail.com
免責聲明
這些資訊和出版物並非旨在提供,也不構成TradingView提供或認可的任何形式的財務、投資、交易或其他類型的建議或推薦。請閱讀使用條款以了解更多資訊。