PROTECTED SOURCE SCRIPT
已更新 Jesse Livermore Strategy [Buy & Sell]
Jesse Livermore was a famous trader who made a fortune in the early 20th century through his unique approach to trading.
While he did not leave behind a single, specific trading strategy that is attributed to him, I have tried to reproduce one.
His trading strategy was based on understanding market trends and sentiment, and he used several technical indicators to identify potential entry and exit points.
Some of the indicators he used include:
Price Action:
Jesse Livermore relied heavily on price action to make trading decisions.
He believed that the price itself was the best indicator of market sentiment, and that by analyzing the price movement, he could identify trends and market behavior.
Volume:
Livermore also used volume to confirm price movements.
He believed that a rise in volume along with a price increase indicated a strong bullish trend, while a decrease in volume with a price increase indicated a weak trend.
Pivot Points:
Another key component of Jesse Livermore's trading strategy was pivot points.
He used pivot points to identify potential support and resistance levels in the market, which he then used to identify potential entry and exit points.
Jesse Livermore outlined a simple trading system: wait for pivotal points before entering a trade.
When the points come into play, trade them using a buffer, trading in the direction of the overall market.
Let the price dictate your actions and stay with profitable trades until there is good reason to exit the trade.
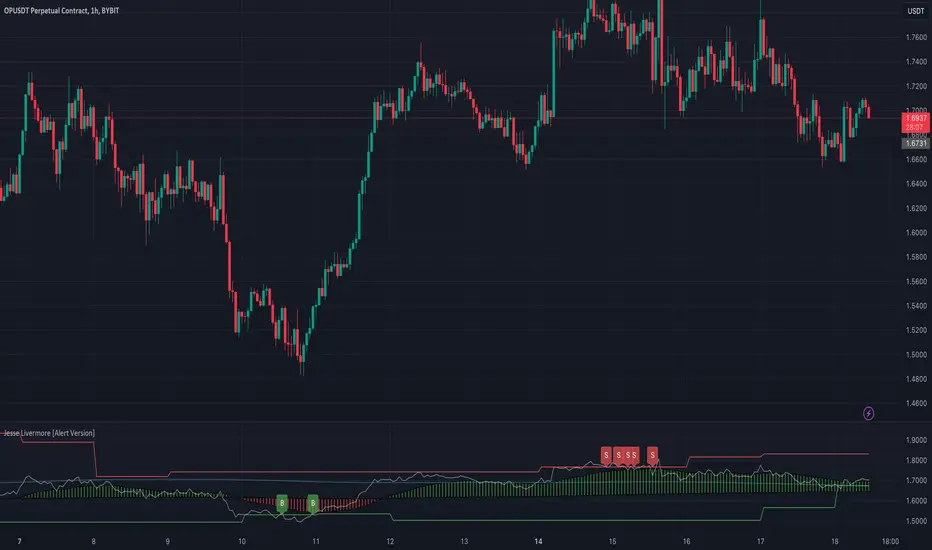
The one I have tried to reproduce it's based on Pivot High and Low looking back 5 Days, and the average price oscillator.
When the price is bellow the support defined line it's time to Buy (Long Position), when the Price line is over the Resistance Line it's time to Sell ( Short Position )
This indicator has to be checked, and tried into a Real-Time context, so using the Replay functionality of TradingView is the best way to see and understand how Signals comes
(NB: look back into the chart without Replay should give you wrong Buy/Sell information)
The Indicator can be used on every TimeFrames, but the better ones are 5min - 15min.
I will add the possibility to choose the TimeFrames value for Pivot High and Low.
I will create a version with Alerts for Buy and Sell and the possibility to integrate it with "3commas Bot" where the best deal can be to set a TP to 1% for each Long or Short Entry.
Let's try it and comment for doubts or questions.
While he did not leave behind a single, specific trading strategy that is attributed to him, I have tried to reproduce one.
His trading strategy was based on understanding market trends and sentiment, and he used several technical indicators to identify potential entry and exit points.
Some of the indicators he used include:
Price Action:
Jesse Livermore relied heavily on price action to make trading decisions.
He believed that the price itself was the best indicator of market sentiment, and that by analyzing the price movement, he could identify trends and market behavior.
Volume:
Livermore also used volume to confirm price movements.
He believed that a rise in volume along with a price increase indicated a strong bullish trend, while a decrease in volume with a price increase indicated a weak trend.
Pivot Points:
Another key component of Jesse Livermore's trading strategy was pivot points.
He used pivot points to identify potential support and resistance levels in the market, which he then used to identify potential entry and exit points.
Jesse Livermore outlined a simple trading system: wait for pivotal points before entering a trade.
When the points come into play, trade them using a buffer, trading in the direction of the overall market.
Let the price dictate your actions and stay with profitable trades until there is good reason to exit the trade.
The one I have tried to reproduce it's based on Pivot High and Low looking back 5 Days, and the average price oscillator.
When the price is bellow the support defined line it's time to Buy (Long Position), when the Price line is over the Resistance Line it's time to Sell ( Short Position )
This indicator has to be checked, and tried into a Real-Time context, so using the Replay functionality of TradingView is the best way to see and understand how Signals comes
(NB: look back into the chart without Replay should give you wrong Buy/Sell information)
The Indicator can be used on every TimeFrames, but the better ones are 5min - 15min.
I will add the possibility to choose the TimeFrames value for Pivot High and Low.
I will create a version with Alerts for Buy and Sell and the possibility to integrate it with "3commas Bot" where the best deal can be to set a TP to 1% for each Long or Short Entry.
Let's try it and comment for doubts or questions.
發行說明
Eliminated Repaint SituationAdded Alert on Buy and Sell Signal
發行說明
Update Alert Label Adding Price Buy or Price Sell發行說明
Updated the sensibility for the Buy Signal發行說明
- Updated Alert Conditions, Buy & Sell發行說明
Updated Buy and Sell Signal [optimization]Removed Repaint on Buy and Sell Signals
發行說明
Optimization of fake BUY and Sell Signals, for a better signal quality.發行說明
Plotting Update發行說明
Removed the last Repaint Situation.Improved Plotting
受保護腳本
此腳本以閉源形式發佈。 不過,您可以自由且不受任何限制地使用它 — 在此處了解更多資訊。
免責聲明
這些資訊和出版物並不意味著也不構成TradingView提供或認可的金融、投資、交易或其他類型的意見或建議。請在使用條款閱讀更多資訊。
免責聲明
這些資訊和出版物並不意味著也不構成TradingView提供或認可的金融、投資、交易或其他類型的意見或建議。請在使用條款閱讀更多資訊。