INVITE-ONLY SCRIPT
Median Shifting Band Oscillator | QuantMAC
📊 Median Shifting Band Oscillator | QuantMAC
🚀 Revolutionary Trend Analysis with Integrated Performance Metrics
The Median Shifting Band Oscillator (MSBO) is a sophisticated technical analysis tool that combines dynamic median-based band calculations with a powerful oscillator to deliver precise trend identification across all market conditions and asset classes.
🎯 Core Features & Functionality
📈 Advanced Median Band Technology
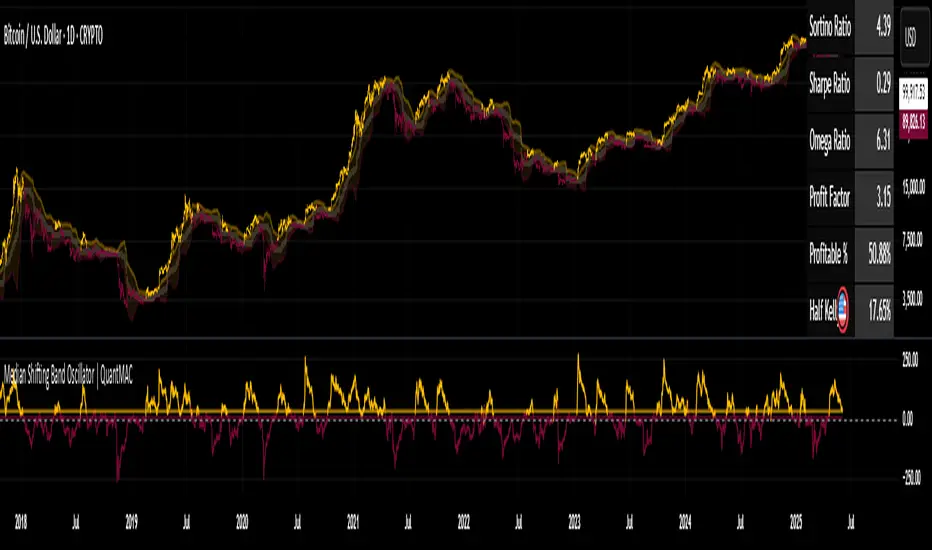
⚡Precision Oscillator System
📊 Integrated Performance Dashboard
🛠️ Trading Modes & Flexibility
🎭 Dual Trading Strategies
🎨 Visual Customization
📈 Performance Metrics Suite
The MSBO includes a comprehensive metrics table displaying:
🌍 Universal Asset Compatibility
✅ Cryptocurrencies - Bitcoin, altcoins, and DeFi tokens
✅ Stock Markets - Individual stocks, ETFs, and indices
🎯 Key Advantages
🔄 Adaptive Intelligence
The median-based approach provides superior noise filtering compared to traditional moving averages, automatically adjusting to changing market volatility patterns.
⚡ Real-time Precision
Advanced signal generation with customizable thresholds ensures optimal entry and exit timing while minimizing false signals.
📊 Professional Analytics
Built-in performance tracking eliminates the need for external backtesting tools, providing instant strategy validation and optimization insights.
🎨 User Experience
Intuitive interface with professional-grade customization options suitable for both retail traders and institutional analysts.
🚀 Getting Started
💡 Pro Tips
---
🏆 Professional-Grade Tool for Serious Traders
The Median Shifting Band Oscillator represents the evolution of technical analysis, combining time-tested statistical methods with modern computational power to deliver actionable trading insights across all market conditions.
💬 Questions? Comments? Share your them below! 👇
---
📝 Disclaimer: This indicator is for educational and informational purposes only. Past performance does not guarantee future results. Always conduct your own analysis and manage risk appropriately.
🚀 Revolutionary Trend Analysis with Integrated Performance Metrics
The Median Shifting Band Oscillator (MSBO) is a sophisticated technical analysis tool that combines dynamic median-based band calculations with a powerful oscillator to deliver precise trend identification across all market conditions and asset classes.
🎯 Core Features & Functionality
📈 Advanced Median Band Technology
- Dynamic median calculation using customizable lookback periods (default 54 bars)
- Adaptive standard deviation bands that adjust to market volatility
- Real-time band positioning with visual overlay on price charts
- Intelligent band fill visualization for enhanced trend clarity
⚡Precision Oscillator System
- Normalized oscillator ranging from -50 to +50 for consistent readings
- Customizable threshold levels for long (80) and short (54) signals
- Multi-timeframe compatibility with real-time signal generation
- Color-coded visualization with 9 professional color schemes
📊 Integrated Performance Dashboard
- Real-time metrics calculation with professional statistics
- Comprehensive risk metrics: Sharpe, Sortino, Omega ratios
- Advanced position sizing with Half Kelly percentage
- Maximum drawdown tracking and profit factor analysis
- Customizable metrics table positioning (6 locations available)
🛠️ Trading Modes & Flexibility
🎭 Dual Trading Strategies
- Long/Short Mode: Full bidirectional trading with short positions
- Long/Cash Mode: Conservative approach with cash positions during bearish signals
🎨 Visual Customization
- 9 professional color schemes (Classic through Classic9)
- Configurable date range limiter for backtesting
- Force overlay plots for seamless chart integration
- Dynamic bar coloring based on trend direction
📈 Performance Metrics Suite
The MSBO includes a comprehensive metrics table displaying:
- Risk Analysis: Maximum Drawdown %, Sharpe Ratio, Sortino Ratio
- Performance Metrics: Net Profit %, Profit Factor, Win Rate %
- Advanced Statistics: Omega Ratio, Half Kelly %, Total Trades
- Real-time Updates: Live calculation with every bar confirmation
🌍 Universal Asset Compatibility
✅ Cryptocurrencies - Bitcoin, altcoins, and DeFi tokens
✅ Stock Markets - Individual stocks, ETFs, and indices
🎯 Key Advantages
🔄 Adaptive Intelligence
The median-based approach provides superior noise filtering compared to traditional moving averages, automatically adjusting to changing market volatility patterns.
⚡ Real-time Precision
Advanced signal generation with customizable thresholds ensures optimal entry and exit timing while minimizing false signals.
📊 Professional Analytics
Built-in performance tracking eliminates the need for external backtesting tools, providing instant strategy validation and optimization insights.
🎨 User Experience
Intuitive interface with professional-grade customization options suitable for both retail traders and institutional analysts.
🚀 Getting Started
- Add the indicator to your chart
- Configure your preferred color scheme and trading mode
- Adjust threshold levels based on your risk tolerance
- Enable the metrics table for performance tracking
- Set date range for historical analysis (optional)
💡 Pro Tips
- Trend Confirmation: Use oscillator position relative to zero line for primary trend bias
- Signal Quality: Higher threshold values reduce signal frequency but increase accuracy
- Multi-Timeframe: Combine with higher timeframe analysis for enhanced precision
- Risk Management: Monitor Half Kelly % for optimal position sizing guidance
---
🏆 Professional-Grade Tool for Serious Traders
The Median Shifting Band Oscillator represents the evolution of technical analysis, combining time-tested statistical methods with modern computational power to deliver actionable trading insights across all market conditions.
💬 Questions? Comments? Share your them below! 👇
---
📝 Disclaimer: This indicator is for educational and informational purposes only. Past performance does not guarantee future results. Always conduct your own analysis and manage risk appropriately.
免責聲明
這些資訊和出版物並非旨在提供,也不構成TradingView提供或認可的任何形式的財務、投資、交易或其他類型的建議或推薦。請閱讀使用條款以了解更多資訊。