PROTECTED SOURCE SCRIPT
Tweezer Pattern
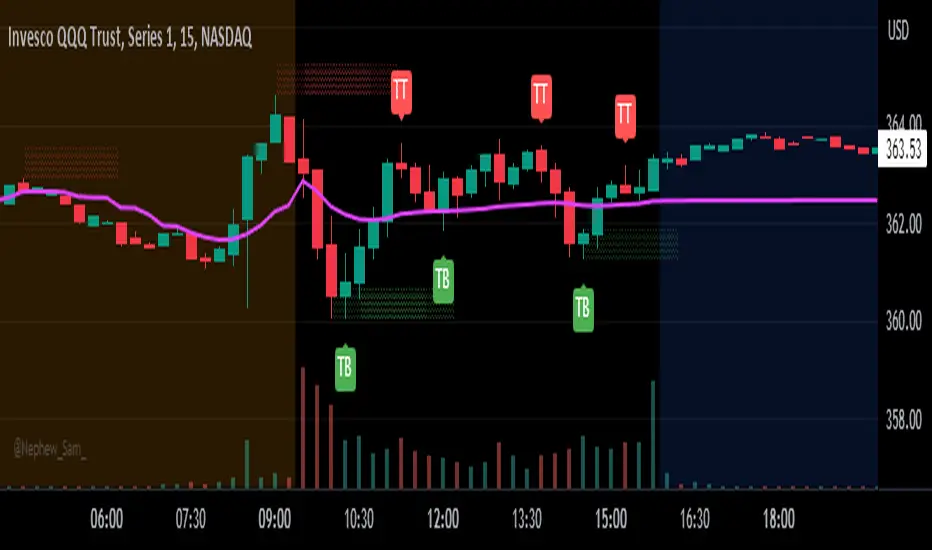
This is a rudimentary indicator to plot tweezer bottoms and tweezer tops. I use this primarily on the 15 minute, but may be applicable to other timeframes.
Criteria for a Tweezer Bottom:
- We were previously in a downtrend (determined by the color of the previous two candles)
- The current candle is green
- The current and previous candle have lower wicks
- The current candle open is approximately the same as the previous candle close (adjustable through settings)
Criteria for a Tweezer Top:
- We were previously in an uptrend (determined by the color of the previous two candles)
- The current candle is red
- The current and previous candle have upper wicks
- The current candle open is approximately the same as the previous candle close (adjustable through settings)
Potential Improvements:
- Determine trend through TA, for example using SMAs
- Ensure wick length as some percentage of candle height instead of just checking for existence
- Ensure tweezer candle is large or has some required minimum volume to reduce false positives
For any improvements or ideas, feel free to contact me :)
受保護腳本
此腳本以閉源形式發佈。 不過,您可以自由使用,沒有任何限制 — 點擊此處了解更多。
免責聲明
這些資訊和出版物並非旨在提供,也不構成TradingView提供或認可的任何形式的財務、投資、交易或其他類型的建議或推薦。請閱讀使用條款以了解更多資訊。
免責聲明
這些資訊和出版物並非旨在提供,也不構成TradingView提供或認可的任何形式的財務、投資、交易或其他類型的建議或推薦。請閱讀使用條款以了解更多資訊。