OPEN-SOURCE SCRIPT
RS Alpha by The Noiseless Trader
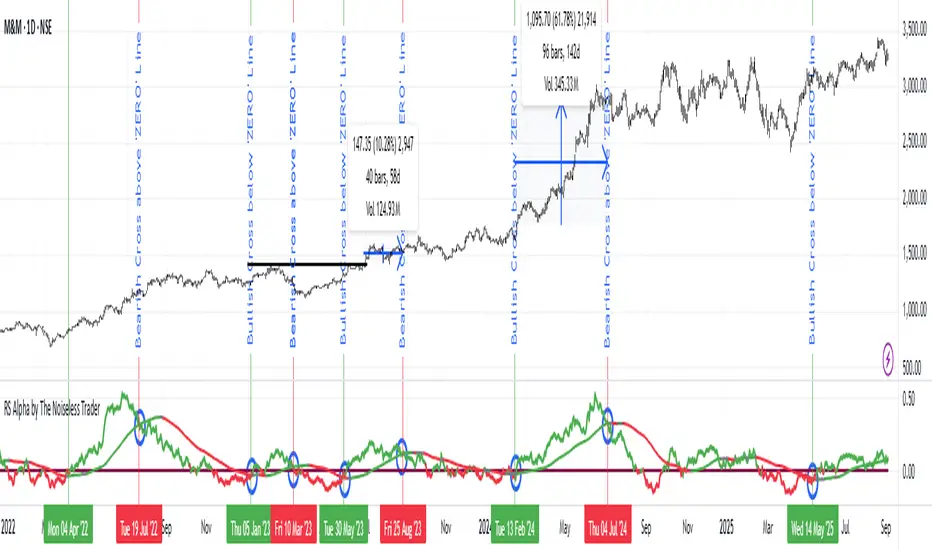
RS Alpha by The Noiseless Trader plots a clean, benchmark‑relative strength line for any symbol and (optionally) a mean line to assess trend and momentum in relative performance. It’s designed for uncluttered, professional RS analysis and works across any timeframe.
Tip: Use RS to identify leaders (RS > 0 with rising mean) and laggards (RS < 0 with falling mean), then align setups with your price action rules.
Reading the indicator
Alerts
(Use these as context; execute entries on your price‑action rules.)
Best practices
Credits
Original concept & code: © bharatTrader
Modifications & refinements: The Noiseless Trader
- Compare any symbol vs a benchmark (default: NSE:NIFTY).
- Optional log‑normalized RS for return‑aware comparisons.
- Optional RS Mean with trend coloring (rising/falling).
- Optional RS Trend zero‑line coloring based on short‑range slope.
- Lightweight alerts for rising/falling RS mean.
Tip: Use RS to identify leaders (RS > 0 with rising mean) and laggards (RS < 0 with falling mean), then align setups with your price action rules.
Reading the indicator
- Leadership: RS > 0 and RS Mean rising → outperformance vs benchmark.
- Weakness: RS < 0 and RS Mean falling → underperformance vs benchmark.
- Inflections: Watch RS crossing above/below its Mean for early shifts.
- Zero‑line context: With RS Trend on, the zero line subtly reflects short‑term slope (green for positive, maroon for negative).
Alerts
- Rising Strength – RS Mean turning/remaining upward.
- Declining Strength – RS Mean turning/remaining downward.
(Use these as context; execute entries on your price‑action rules.)
Best practices
- Pair RS with your trend/structure rules (e.g., higher highs + RS leadership).
- For sectors/baskets, keep the Comparative Symbol consistent to rank peers.
- Log‑normalized RS helps when comparing assets with very different volatilities or large base effects.
- Test multiple length and Mean settings; 60 is a balanced default for swing/positional work.
Credits
Original concept & code: © bharatTrader
Modifications & refinements: The Noiseless Trader
開源腳本
秉持TradingView一貫精神,這個腳本的創作者將其設為開源,以便交易者檢視並驗證其功能。向作者致敬!您可以免費使用此腳本,但請注意,重新發佈代碼需遵守我們的社群規範。
The Noiseless Trader — Structure first. Then price. Then confirmation. | Explore more with TNT One thenoiselesstrader.com/s/pages/tntone | An extensive library of 200+ hours of actionable financial market knowledge
免責聲明
這些資訊和出版物並非旨在提供,也不構成TradingView提供或認可的任何形式的財務、投資、交易或其他類型的建議或推薦。請閱讀使用條款以了解更多資訊。