OPEN-SOURCE SCRIPT
已更新 Relative Performance Table
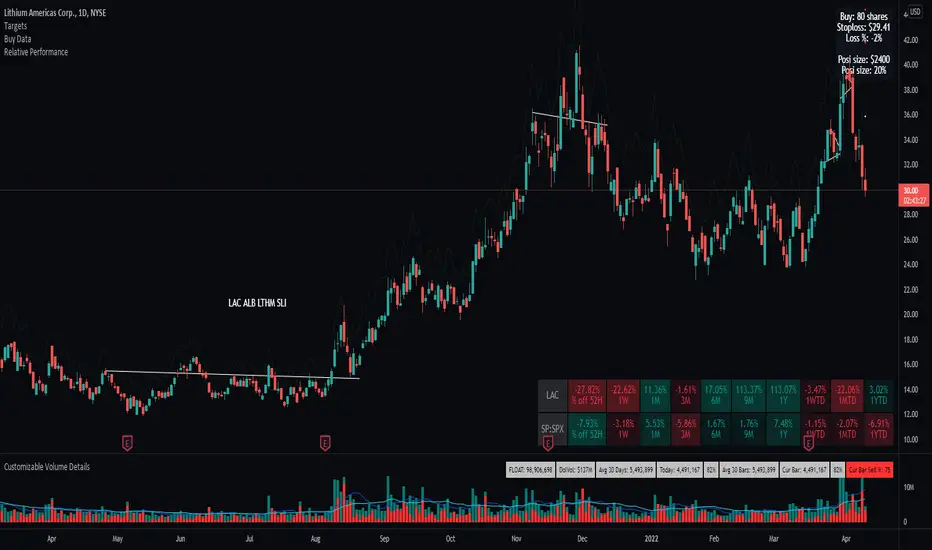
This indicator is based on the Performance section in the TradingView's sidebar and uses new Pine tables functionality, originally coded by @Beeholder. It compares the current price of the symbol to its past price and calculates the rate of return to make it easier to track the performance of the symbol. Note that the Performance sidebar is not updated in real-time, while this indicator is, so on real-time charts the values between the two can differ (the indicator's values are more recent). Made a number of enhancement from Bee's script including relative performance of a selected ticker, dynamic table columns, and other options.
The formula of the calculation is (Current value - Past value) * 100 / Past value, where Past value is:
--Future development will include the ability to transpose the table columns/rows
The formula of the calculation is (Current value - Past value) * 100 / Past value, where Past value is:
- 1W
- 1M
- 3M
- 6M
- 9M
- 52W (1 Year)
- WTD (Week to Date)
- MTD (Month to Date)
- YTD (Year to Date
--Future development will include the ability to transpose the table columns/rows
發行說明
--Minor fix to tooltip發行說明
Added 52 week high calculation to quickly screen whether a ticker is within 25% of the 52 week Highs開源腳本
秉持TradingView一貫精神,這個腳本的創作者將其設為開源,以便交易者檢視並驗證其功能。向作者致敬!您可以免費使用此腳本,但請注意,重新發佈代碼需遵守我們的社群規範。
免責聲明
這些資訊和出版物並非旨在提供,也不構成TradingView提供或認可的任何形式的財務、投資、交易或其他類型的建議或推薦。請閱讀使用條款以了解更多資訊。
免責聲明
這些資訊和出版物並非旨在提供,也不構成TradingView提供或認可的任何形式的財務、投資、交易或其他類型的建議或推薦。請閱讀使用條款以了解更多資訊。