OPEN-SOURCE SCRIPT
Multi-TimeFrame RSI Divergence
1. Table Usage
The table shows all divergences for each timeframe (5m → 4h).
Columns:
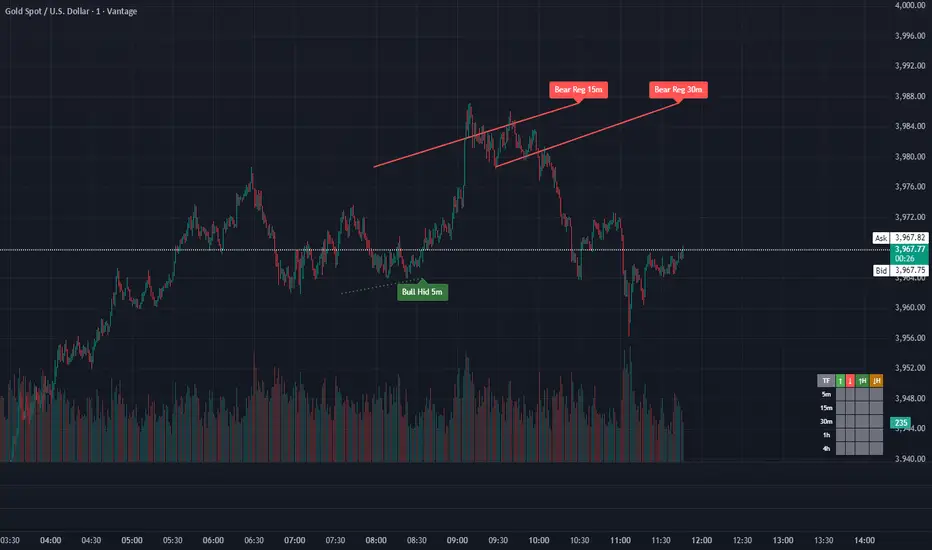
Bull Reg → Regular bullish divergence
Bear Reg → Regular bearish divergence
Bull Hid → Hidden bullish divergence
Bear Hid → Hidden bearish divergence
Movable via inputs: adjust Table X Position (bars from left) and Table Y Position (price level).
Customizable timeframe text color: set via TF Color input.
2. Reading Divergences
Lines on the chart:
Solid green/red = regular divergence
Dotted = hidden divergence
Dashed = RSI side of divergence
Labels appear at the pivot points to indicate type and timeframe.
3. Timeframes
Works on 5m, 15m, 30m, 1h, and 4h.
Each timeframe is independent, so divergences are correctly detected even if higher or lower TFs don’t show anything yet.
4. Adjusting Sensitivity
Pivot Left Bars / Pivot Right Bars → controls how sensitive pivots are.
Lower values = more pivots detected (shorter-term swings).
Higher values = smoother pivots, fewer false signals.
Pivot search lookback → how far back the script searches for pivots.
RSI Length → default is 14, but can be adjusted for faster/slower RSI responsiveness.
5. Line and Label Cleanup
Expire lines/labels after N bars → prevents the chart from cluttering.
Older lines/labels are automatically deleted after this many bars.
6. Practical Tips
Use multiple charts or TradingView layouts: you can run the script on one chart and visually track divergences across TFs without switching.
Combine with support/resistance levels or trend analysis for higher-probability trades.
Watch for hidden divergences on pullbacks → often signal trend continuation.
The table shows all divergences for each timeframe (5m → 4h).
Columns:
Bull Reg → Regular bullish divergence
Bear Reg → Regular bearish divergence
Bull Hid → Hidden bullish divergence
Bear Hid → Hidden bearish divergence
Movable via inputs: adjust Table X Position (bars from left) and Table Y Position (price level).
Customizable timeframe text color: set via TF Color input.
2. Reading Divergences
Lines on the chart:
Solid green/red = regular divergence
Dotted = hidden divergence
Dashed = RSI side of divergence
Labels appear at the pivot points to indicate type and timeframe.
3. Timeframes
Works on 5m, 15m, 30m, 1h, and 4h.
Each timeframe is independent, so divergences are correctly detected even if higher or lower TFs don’t show anything yet.
4. Adjusting Sensitivity
Pivot Left Bars / Pivot Right Bars → controls how sensitive pivots are.
Lower values = more pivots detected (shorter-term swings).
Higher values = smoother pivots, fewer false signals.
Pivot search lookback → how far back the script searches for pivots.
RSI Length → default is 14, but can be adjusted for faster/slower RSI responsiveness.
5. Line and Label Cleanup
Expire lines/labels after N bars → prevents the chart from cluttering.
Older lines/labels are automatically deleted after this many bars.
6. Practical Tips
Use multiple charts or TradingView layouts: you can run the script on one chart and visually track divergences across TFs without switching.
Combine with support/resistance levels or trend analysis for higher-probability trades.
Watch for hidden divergences on pullbacks → often signal trend continuation.
開源腳本
本著TradingView的真正精神,此腳本的創建者將其開源,以便交易者可以查看和驗證其功能。向作者致敬!雖然您可以免費使用它,但請記住,重新發佈程式碼必須遵守我們的網站規則。
免責聲明
這些資訊和出版物並不意味著也不構成TradingView提供或認可的金融、投資、交易或其他類型的意見或建議。請在使用條款閱讀更多資訊。
開源腳本
本著TradingView的真正精神,此腳本的創建者將其開源,以便交易者可以查看和驗證其功能。向作者致敬!雖然您可以免費使用它,但請記住,重新發佈程式碼必須遵守我們的網站規則。
免責聲明
這些資訊和出版物並不意味著也不構成TradingView提供或認可的金融、投資、交易或其他類型的意見或建議。請在使用條款閱讀更多資訊。