OPEN-SOURCE SCRIPT
CAGR + Log Slope Color
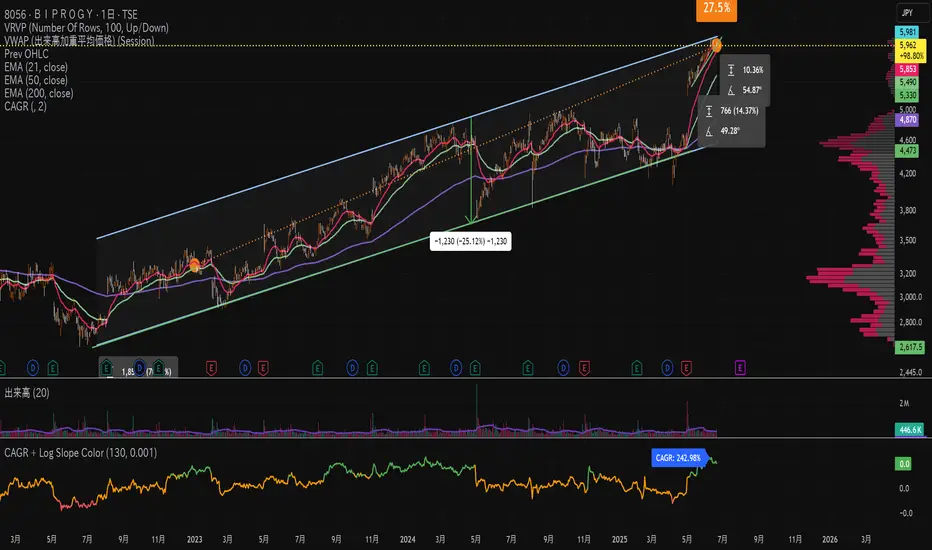
This custom TradingView indicator combines two important analytical concepts to help traders identify strong trends with visual clarity:
CAGR (Compound Annual Growth Rate):
Measures the geometric average annual return of the asset over a specified period. It smooths out short-term fluctuations and provides a long-term growth perspective.
Logarithmic Slope Coloring:
The slope of the log-scaled price is calculated and visualized with color gradients. Steeper upward slopes indicate stronger momentum and are highlighted with more intense colors. Downward slopes are shown in contrasting colors for easier identification of bearish trends.
開源腳本
秉持TradingView一貫精神,這個腳本的創作者將其設為開源,以便交易者檢視並驗證其功能。向作者致敬!您可以免費使用此腳本,但請注意,重新發佈代碼需遵守我們的社群規範。
免責聲明
這些資訊和出版物並非旨在提供,也不構成TradingView提供或認可的任何形式的財務、投資、交易或其他類型的建議或推薦。請閱讀使用條款以了解更多資訊。
開源腳本
秉持TradingView一貫精神,這個腳本的創作者將其設為開源,以便交易者檢視並驗證其功能。向作者致敬!您可以免費使用此腳本,但請注意,重新發佈代碼需遵守我們的社群規範。
免責聲明
這些資訊和出版物並非旨在提供,也不構成TradingView提供或認可的任何形式的財務、投資、交易或其他類型的建議或推薦。請閱讀使用條款以了解更多資訊。