OPEN-SOURCE SCRIPT
已更新 Ichimoku Bars
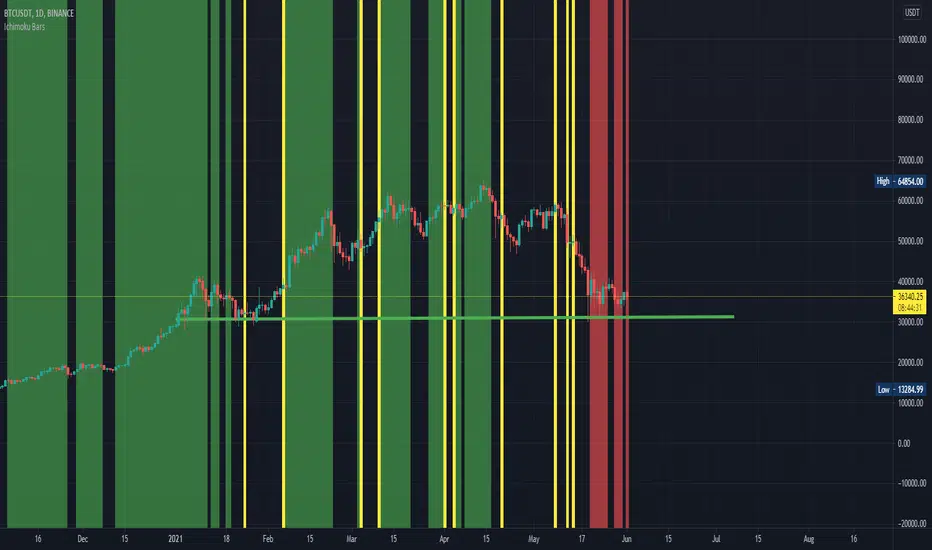
This script follows off the principles of the Ichimoku Cloud indicator. The green zones display optimal time to buy according to the Ichimoku model. The red zones show optimal time to sell according to the Ichimoku model inverse. The yellow zones show where the conversion line meets the base line (potential up or down movement at this point). Feel free to contact me to fix any problems or add additional info.
發行說明
Update 1: Fixed yellow bars to show all locations where conversion line meets the base line. 發行說明
Added the ability to turn On/Off the Ichimoku Cloud indicator on top of the Ichimoku Bars. This feature is useful for peoplpe who use the free version of TradingView where the number of indicators to have on at once is limited. 發行說明
Added Ichimoku Cloud category. Fixed fill bug. 發行說明
Updated color format to the newer version. Console should now show no depreciating errors. 發行說明
Cleaned up the code and updated to version 5!開源腳本
秉持TradingView一貫精神,這個腳本的創作者將其設為開源,以便交易者檢視並驗證其功能。向作者致敬!您可以免費使用此腳本,但請注意,重新發佈代碼需遵守我們的社群規範。
免責聲明
這些資訊和出版物並非旨在提供,也不構成TradingView提供或認可的任何形式的財務、投資、交易或其他類型的建議或推薦。請閱讀使用條款以了解更多資訊。
免責聲明
這些資訊和出版物並非旨在提供,也不構成TradingView提供或認可的任何形式的財務、投資、交易或其他類型的建議或推薦。請閱讀使用條款以了解更多資訊。