OPEN-SOURCE SCRIPT
已更新 Simple Sessions

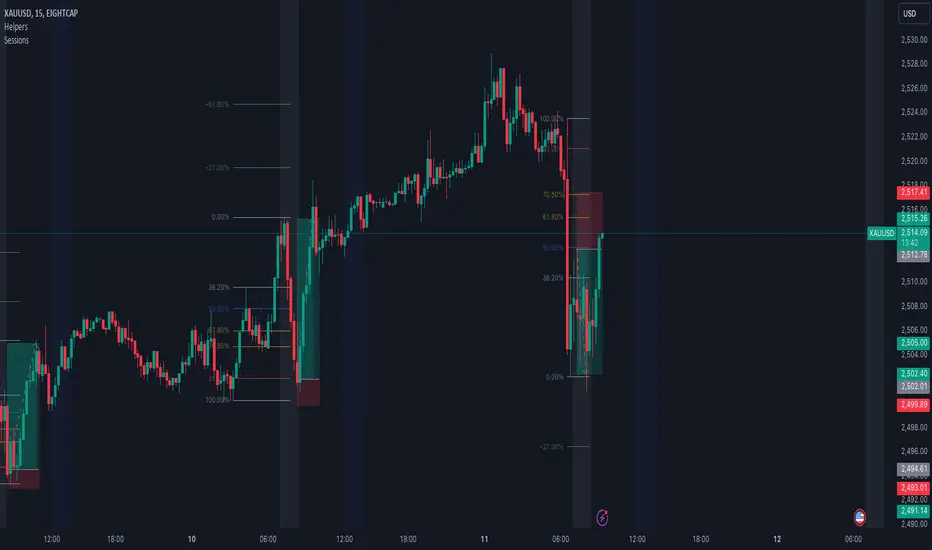
This is a simple sessions indicator that allows you to highlight up to 3 different sessions on your chart. This is intended for charts in any timeframe lower than the Daily timeframe. Really simple, clean, and minimalistic on purpose, intended to help and not clutter the chart.
Options/parameters:
Options/parameters:
- Sessions: Check and setup beginning and end of the sessions. Up to 3 sessions at the same time.
- Enable specific timezone: You can specify your exact timezone so that the sessions stay consistent even when you’re viewing different assets from different brokers that might be providing the price data in different timezones.
- Show next day: Check to allow for your sessions to be viewed in advance for the following day so that you can expect your trading session in the chart (something simple, but quite useful).
- Show next day input also accepts an integer value (default at 0). This numeric value is useful only for a few different assets that don’t have price data (aren’t tradable) 24 hours of each week-day. When that’s the case the calculation to show the session in the future day is not precise so with this number you can adjust it. For example, on
SPX500USD in the 30m time-frame, between 5pm and 6pm NY time there’s no price data. If you check that chart on any day at 4:30pm NY time, the next bar should be at 5pm, however since there’s no data it jumps to 6pm NY time. For that example you can set the input number to -2 and it will move the sessions to the correct time window you specified in the Sessions input.
- Optional comment: This is a comment that will be shown in the status line. There’s no other use for this. It’s only helpful when you have multiple instances of the indicator for different assets for example. In that case with this comment you would be able to instantly detect which indicator is for which chart.
發行說明
This is a simple sessions indicator that allows you to highlight up to 3 different sessions on your chart. This is intended for charts in any timeframe lower than the Daily timeframe. Really simple, clean, and minimalistic on purpose, intended to help and not clutter the chart.Options/parameters:
- Sessions: Check and setup beginning and end of the sessions. Up to 3 sessions at the same time.
- Enable specific timezone: You can specify your exact timezone so that the sessions stay consistent even when you’re viewing different assets from different brokers that might be providing the price data in different timezones.
- Show next day: Check to allow for your sessions to be viewed in advance for the following day so that you can expect your trading session in the chart (something simple, but quite useful).
- Optional comment: This is a comment that will be shown in the status line. There’s no other use for this. It’s only helpful when you have multiple instances of the indicator for different assets for example. In that case with this comment you would be able to instantly detect which indicator is for which chart.
Notes on showing the next day's session:
In the previous version I was calculating the number of seconds in a day and dividing that by the number of seconds of the chart's timeframe to calculate how many bars there were in a day for the current asset. However this turned to be imprecise for a few different assets that don’t have price data (aren’t tradable) 24 hours of each week-day (such as the
tfInSeconds = timeframe.in_seconds(timeframe.period)
dayInSeconds = timeframe.in_seconds("1D")
barsOffset = (tfInSeconds < dayInSeconds and i_shouldOffset) ? (dayInSeconds / tfInSeconds) + i_additionalOffset : 0
To solve this problem in a better way, with this release, I'm calculating the bars between each session every day and using that amount to offset.
isFirstSessionCandle = i_plotSession1 ? inSession1 and not(inSession1[1]) :
i_plotSession2 ? inSession2 and not(inSession2[1]) :
i_plotSession3 ? inSession3 and not(inSession3[1]) : false
firstCandleIndex = ta.barssince(isFirstSessionCandle)
barsBetweenLastSession = firstCandleIndex > firstCandleIndex[1] ? firstCandleIndex : firstCandleIndex[1]
var int barsBetweenSession = na
if na(barsBetweenSession) or firstCandleIndex > barsBetweenSession
barsBetweenSession := firstCandleIndex
if isFirstSessionCandle and barsBetweenLastSession > firstCandleIndex
barsBetweenSession := barsBetweenLastSession
barsAhead = i_shouldOffset ? barsBetweenSession + 1 : 0
This method might still be not 100% precise when there's missing price data randomly in a single day for whatever reason, but it will be fixed in the following day. I haven't experienced this issue, it's just a possibility that came to my mind. This solution is better than the previous one as it will now calculate much more precisely the bars between the sessions and offset correctly in 99% of the times to show the following day's session so you can expect it.
Small downside: the resulting value of
barsAhead
開源腳本
本著TradingView的真正精神,此腳本的創建者將其開源,以便交易者可以查看和驗證其功能。向作者致敬!雖然您可以免費使用它,但請記住,重新發佈程式碼必須遵守我們的網站規則。
免責聲明
這些資訊和出版物並不意味著也不構成TradingView提供或認可的金融、投資、交易或其他類型的意見或建議。請在使用條款閱讀更多資訊。
開源腳本
本著TradingView的真正精神,此腳本的創建者將其開源,以便交易者可以查看和驗證其功能。向作者致敬!雖然您可以免費使用它,但請記住,重新發佈程式碼必須遵守我們的網站規則。
免責聲明
這些資訊和出版物並不意味著也不構成TradingView提供或認可的金融、投資、交易或其他類型的意見或建議。請在使用條款閱讀更多資訊。