PROTECTED SOURCE SCRIPT
EMAS Signal DX
Hello all,
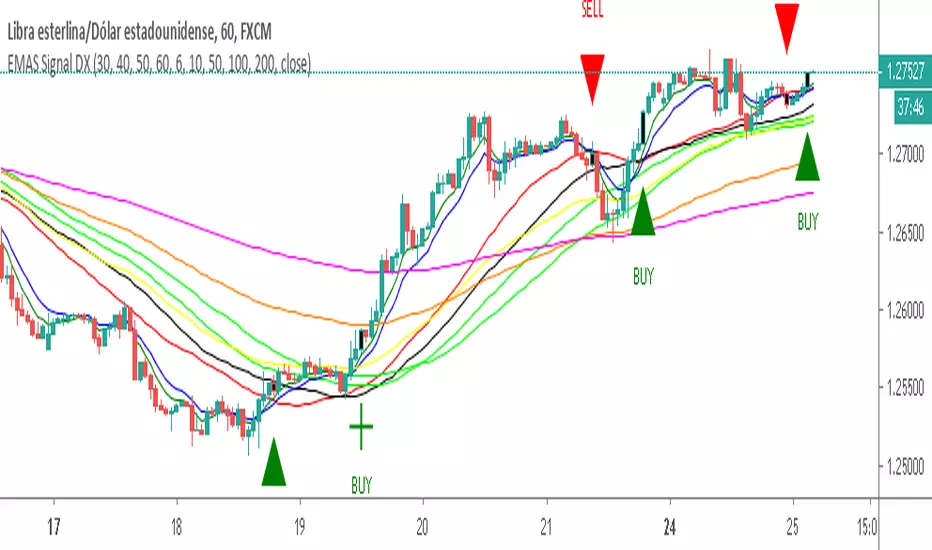
Vs2 of EMAS Signal Double Cross indicator that plots 5 EMA lines and 4 SMA .
Features:
-Signals are represented visually as a triangle on the chart.
-Also represented visually as bar color on the chart.
-When SMA and EMA 1 cross - a Long signal is called if SMA cross above EMA 1, a short if the cross is below EMA 1.
-When EMA 2 and EMA 3 cross - a Long signal is called if EMA 2 cross above EMA 3, a short if the cross is below EMA 3.
-You can activate and deactivate the triangles and the color of the bars.
That’s it, happy pips!
受保護腳本
此腳本以閉源形式發佈。 不過,您可以自由使用,沒有任何限制 — 點擊此處了解更多。
免責聲明
這些資訊和出版物並非旨在提供,也不構成TradingView提供或認可的任何形式的財務、投資、交易或其他類型的建議或推薦。請閱讀使用條款以了解更多資訊。
免責聲明
這些資訊和出版物並非旨在提供,也不構成TradingView提供或認可的任何形式的財務、投資、交易或其他類型的建議或推薦。請閱讀使用條款以了解更多資訊。