INVITE-ONLY SCRIPT
已更新 Bentobox
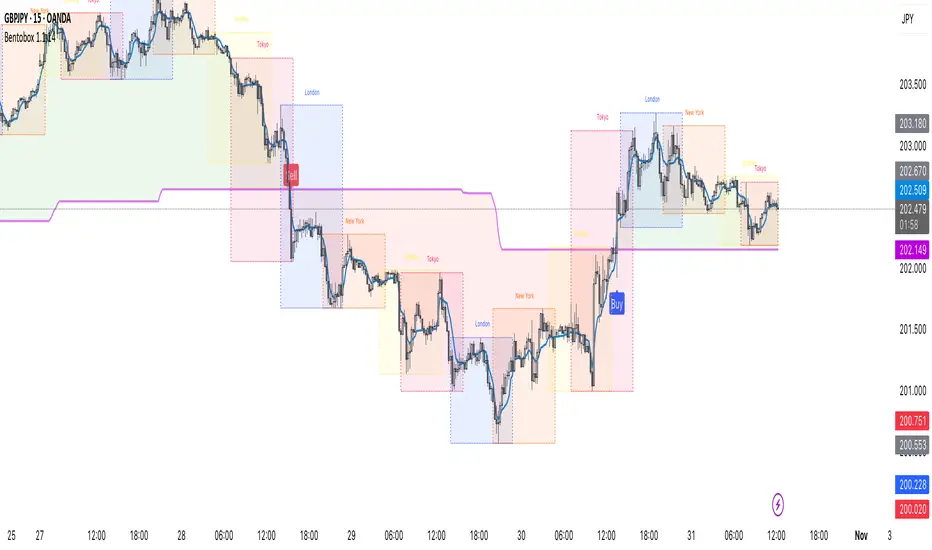
The "Bentobox" indicator is a comprehensive, overlay-based trend-following system for TradingView. Its primary function is to identify the main market trend and provide potential buy and sell signals based on a customized version of the "Optimized Trend Tracker" (OTT) logic.
It plots directly on the price chart, providing clear visual cues through a combination of lines, background highlighting, and signal labels.
Core Components
Support Line (Moving Average):
This is the foundational calculation of the indicator.
It is a moving average of the price (using the 'Source' input, default is close).
The user can choose from eight different moving average types: SMA, EMA, WMA, TMA, VAR (a custom Variable MA), WWMA (Welles Wilder's MA), ZLEMA (Zero-Lag EMA), and TSF (Time Series Forecast).
OTT Line (Main Trend Line):
This is the indicator's main plot and the core of the trend-following logic.
It functions as a dynamic, trailing stop-loss line that adjusts based on the "Support Line" (the selected MA) and a user-defined "Percent" value.
In an uptrend, the line trails below the price and only moves up or sideways.
In a downtrend, it trails above the price and only moves down or sideways.
A crossover of the "Support Line" above or below this OTT line is what determines a change in the calculated trend.
Visuals and Signals
The indicator provides multiple visual aids and signal options:
Trend Highlighter: Fills the background area between the price and the OTT line. By default, it's green when the "Support Line" is above the OTT line (uptrend) and red when it's below (downtrend).
OTT Line Coloring: The OTT line itself can be set to change color (e.g., green for up, red for down) when the trend direction flips.
Buy/Sell Signals: The user can enable three different types of "Buy" and "Sell" labels on the chart:
Price/OTT Crossing: A signal appears when the price (src) crosses over or under the main OTT line.
Support Line Crossing: A signal appears when the "Support Line" (the MA) crosses over or under the main OTT line.
OTT Color Change: A signal appears at the moment the OTT line itself changes its calculated trend direction.
User Inputs (Settings)
The indicator is highly customizable through its settings:
Source: The price data used for all calculations (e.g., Close, Open, HLC3).
OTT Period: The lookback period (length) for the selected moving average.
OTT Percent: The percentage value used to calculate the distance of the OTT line from the moving average. A smaller value makes it more sensitive to price changes, while a larger value creates a smoother, less responsive line.
Moving Average Type: A dropdown menu to select one of the eight available MAs.
Show/Hide Toggles: A series of checkboxes to enable or disable the "Support Line," the background "Highlighter," and all three types of buy/sell signals.
發行說明
Updated Chart發行說明
Update: Added trading sessions發行說明
Small fix發行說明
Fix session default time免責聲明
這些資訊和出版物並非旨在提供,也不構成TradingView提供或認可的任何形式的財務、投資、交易或其他類型的建議或推薦。請閱讀使用條款以了解更多資訊。