PROTECTED SOURCE SCRIPT
已更新 Study - Mean Reversion Index

© fareidzulkifli
Disclaimer:
I always felt Pinescript is a very fast to type language with excellent visualization capabilities, so I've been using it as code-testing platform prior to actual coding in other platform.
Having said that, these study scripts was built only to test/visualize an idea to see its viability and if it can be used to optimize existing strategy.
While some of it are useful and most are useless, none of it should be use as main decision maker.
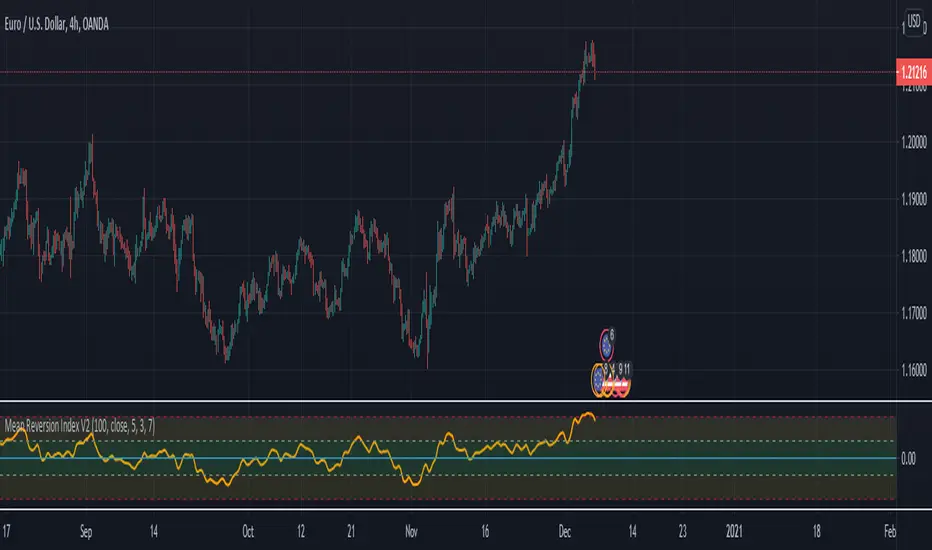
Indicator title : Mean Reversion Index
Description : This index is based on theory that suggests that asset prices and historical returns eventually will revert to the long-run mean or average level of the entire dataset.
Please note that this indicator are not intended to establish a trend bias. It only tells how far the closing price is from the mean price in terms of ATR multiples,
e.g. The green zone indicates that the price is within 3 ATR (default setting) from the mean price.
One way to use it is to determine a safe entry zone to enter current trend from a pullback.
For example, after a sharp retracement during an uptrend, as long as it does not retraced beyond the low of the green zone, Chances are, price is only retraced to its mean value and its not a start of a new downtrend and now ready to continue the uptrend.
More aggressive method to use this is as indicator approaching the higher limit of yellow zone,
prices is to far from the mean and not sustainable, and we can start to look for counter trend opportunity as price reverse to its mean value.
發行說明
- Improve smoothing method - Improve line display
- Added Sensitivity Option (High sensitivity will have more jagged line, and slightly faster reaction to price)
受保護腳本
此腳本以閉源形式發佈。 不過,您可以自由使用,沒有任何限制 — 點擊此處了解更多。
免責聲明
這些資訊和出版物並非旨在提供,也不構成TradingView提供或認可的任何形式的財務、投資、交易或其他類型的建議或推薦。請閱讀使用條款以了解更多資訊。
受保護腳本
此腳本以閉源形式發佈。 不過,您可以自由使用,沒有任何限制 — 點擊此處了解更多。
免責聲明
這些資訊和出版物並非旨在提供,也不構成TradingView提供或認可的任何形式的財務、投資、交易或其他類型的建議或推薦。請閱讀使用條款以了解更多資訊。