OPEN-SOURCE SCRIPT
Monthly Seasonality Trend [DunesIsland]
The Monthly Seasonality Trend [DunesIsland] is a indicator designed to analyze and visualize historical monthly seasonality patterns in financial markets. By calculating the average monthly return over a user-configurable lookback period (1 to 10 years), this indicator provides traders and investors with a clear projection of potential price movements for the current month, enabling data-driven decision-making.
How It Works
The indicator operates by retrieving monthly open and close prices for the specified lookback period (up to 10 years) and computing the average percentage return for the current month based on historical data. Key functionalities include:
How to Interpret
How It Works
The indicator operates by retrieving monthly open and close prices for the specified lookback period (up to 10 years) and computing the average percentage return for the current month based on historical data. Key functionalities include:
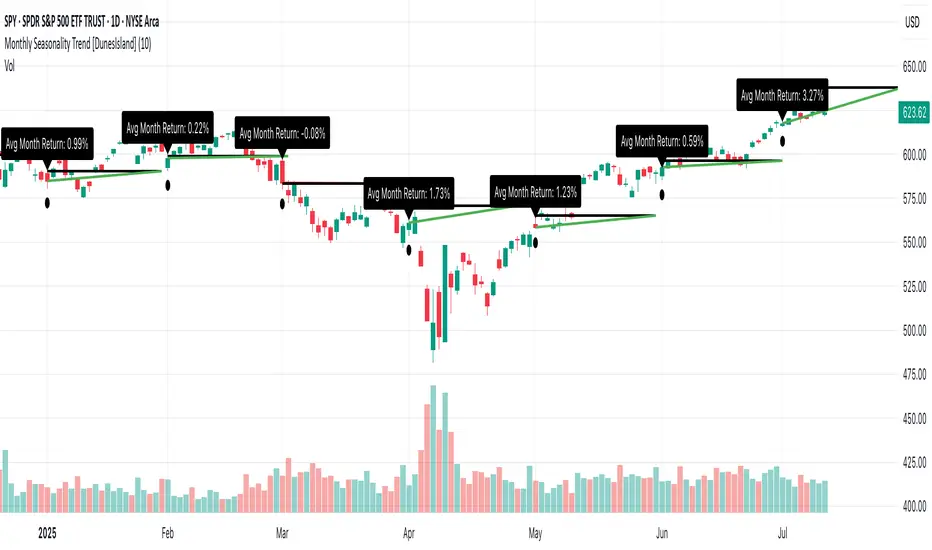
- Dynamic Trend Line: On the first trading day of each month, the indicator plots a line projecting the expected price trajectory, starting from the current close price and extending to the estimated end-of-month price based on the average historical return. The line is colored green for anticipated price increases or red for expected declines, offering an intuitive visual cue.
- Average Return Label: A label is displayed at the start of each month, detailing the calculated average historical return for that month, expressed as a percentage, to provide context for the projected trend.
- First Trading Day Marker: A small circle is plotted below the bar on the first trading day of each month, clearly marking the start of the projection period.
- Adaptive Bar Counting: The indicator dynamically adjusts the length of the trend line based on the actual number of trading days in the previous month, ensuring accurate projections.
How to Interpret
- Bullish Projection (Green Line): Indicates that historical data suggests an average price increase for the current month, potentially signaling buying opportunities.
- Bearish Projection (Red Line): Suggests an average price decline based on historical trends, which may prompt caution or short-selling strategies.
- Historical Context: The average return label provides a quantitative measure of past performance, helping traders assess the reliability of the projected trend.
開源腳本
秉持TradingView一貫精神,這個腳本的創作者將其設為開源,以便交易者檢視並驗證其功能。向作者致敬!您可以免費使用此腳本,但請注意,重新發佈代碼需遵守我們的社群規範。
免責聲明
這些資訊和出版物並非旨在提供,也不構成TradingView提供或認可的任何形式的財務、投資、交易或其他類型的建議或推薦。請閱讀使用條款以了解更多資訊。
開源腳本
秉持TradingView一貫精神,這個腳本的創作者將其設為開源,以便交易者檢視並驗證其功能。向作者致敬!您可以免費使用此腳本,但請注意,重新發佈代碼需遵守我們的社群規範。
免責聲明
這些資訊和出版物並非旨在提供,也不構成TradingView提供或認可的任何形式的財務、投資、交易或其他類型的建議或推薦。請閱讀使用條款以了解更多資訊。