INVITE-ONLY SCRIPT
CMR Goldfish

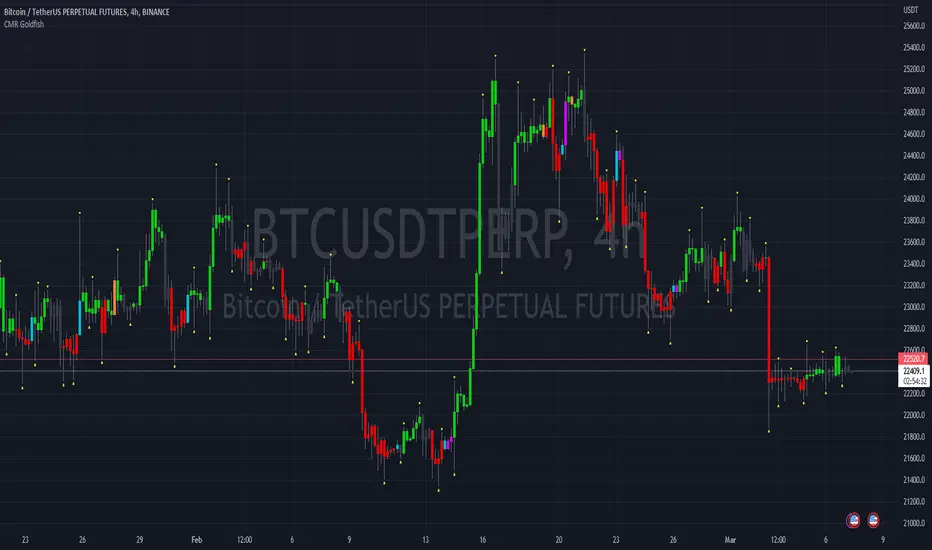
The Goldfish indicator gives you a view into how the market is moving and how money is flowing into or out of the market. It color codes the candlesticks with bullish , bearish and hedged colors.
Looking at multiple timeframes the indicator gives insight into witch direction the market is moving and helps indicate good entry and exit points.
The indicator works on all timeframes and markets. Within the setting the Indicator can be fine tuned to the market you are watching.
The Indicator paints the candles. You need to either hide the regular candles or bring the indicators visual order to the front.
Goldfish Indicator Overview
Green = bullish
Red = bearish
Black = neutral
Purple = hedged, this means we have bullish and bearish
Blue = hedged, with possible long entry
Orange = hedged with possible short entry
Trade
Enter a Long trade on a blue or first geen candle
Enter a Short on an orange or first red candle
Hedge in pink
No trades on black
免責聲明
這些資訊和出版物並不意味著也不構成TradingView提供或認可的金融、投資、交易或其他類型的意見或建議。請在使用條款閱讀更多資訊。