INVITE-ONLY SCRIPT
RWEDT Weighted Moving Average
Overview:
The RWEDT MA, which is short for rolling, weighted, exponential, double exponential, and triple exponential, is a group of moving averages that were subjected to a log transformation to deal with the skewness of price, and the weight of each of these moving averages was also used for calculating the standard deviations from the mean.

Clearing a misunderstanding on Standard Deviation Bands and Moving Averages

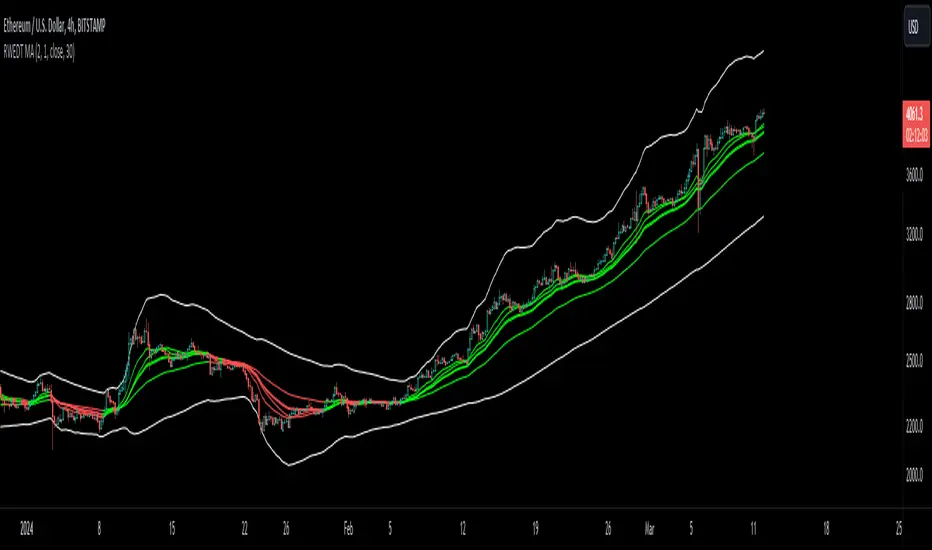
RWEDT MA
This indicator comes with 5 moving averages, each log transformed to reduce the skewness and asymmetry of price as much as possible
The band standard deviation can be adjusted, and the standard deviations have the weight of all of the moving averages that are present in the indicator. The weight is not customizable.
Why this indicator is useful:
The importance of log-transforming prices for standard deviations and moving averages.

The RWEDT MA, which is short for rolling, weighted, exponential, double exponential, and triple exponential, is a group of moving averages that were subjected to a log transformation to deal with the skewness of price, and the weight of each of these moving averages was also used for calculating the standard deviations from the mean.
Clearing a misunderstanding on Standard Deviation Bands and Moving Averages
- Bands, such as standard deviation bands, are frequently misinterpreted as indicators of support and resistance levels or as "mean-reverting" indicators." However, this is not their intended purpose. Bands are statistical tools that provide ranges within which price (in this case) movements are expected to occur based on historical data. Deviations beyond these bands suggest a decrease in confidence in the model rather than a reversal back to a moving average or a "support/resistance level."
- Example: Assuming you correctly applied a log transformation to your standard deviation bands to remove the right skew, and assuming your data closely resembles a normal distribution or some other type of symmetrical distribution, then the probability of a value being in the 2 standard deviation range is around 95%. This does not mean it will reject or go up, or mean revert. The price won't bounce from -2 STDEV 95% of the time; that is incorrect. It just tells you that around 95% of the values will be within the 2 SD range.
- Moving averages, including the ones in this indicator, are often misinterpreted as signals of trend reversals or levels of "bouncing." What moving averages actually tell you is what the expected value is. It does not show where you expect the price to be in the future; it tells you that based on the lookback, the expected value is in the center, and the confidence you have in the estimate is the confidence interval or the standard deviation range.
- Example: Let's say you enter a trade with a positive expected value (expecting the price to drift up), and we have the limits set at 95%. What it tells you is that as long as the price stays within the limits, you can be 95% certain the model isn't completely random. As the price moves further away from the average, or expected value, it tells you that the model is less likely to be correct.
RWEDT MA
This indicator comes with 5 moving averages, each log transformed to reduce the skewness and asymmetry of price as much as possible
- Rolling
- Weighted
- Exponential
- Double Exponential
- Triple Exponential
The band standard deviation can be adjusted, and the standard deviations have the weight of all of the moving averages that are present in the indicator. The weight is not customizable.
Why this indicator is useful:
- This indicator can tell you what the expected value is. Above the moving average signifies a positive expected value, and below the moving average signifies a negative expected value. As previously stated above, the price moving further from the expected value lets you know that you should have less confidence that the model is "correct," and you could see this as taking profits as the price deviates further from the expected value.
The importance of log-transforming prices for standard deviations and moving averages.
- Symmetry: Logarithmic transformations can help achieve symmetry in the distribution of price data. Stock prices, for example, exhibit some type of right-skewed distribution, where large positive price movements are more common than large negative movements. Price also can't go below 0 but can go towards positive infinity, so having a right-skew makes sense; all the outliers will be towards infinity, while all the average occurrences are "near" 0.
- Stabilizing Variance: Price data typically exhibit heteroscedasticity, meaning that the variance of price movements changes over time. Log transformations can stabilize the variance and make it more consistent across different price levels. This is important for ensuring that the variability in price moves is not disproportionately influenced by extreme values.
- Statistical Assumptions: Many retail indicators like Bollinger Bands use the standard deviation and moving average models of a normal distribution to attempt to model price, whose distribution more closely resembles some type of right-skew distribution. Even with the log-transformation, it still won't always resemble a perfect symmetrical distribution, and you still should not use it for mean reversion. You can still use it to understand the expected value and whether or not you should have confidence in your model.
僅限邀請腳本
僅作者批准的使用者才能訪問此腳本。您需要申請並獲得使用許可,通常需在付款後才能取得。更多詳情,請依照作者以下的指示操作,或直接聯絡Traders_Endeavors。
TradingView不建議在未完全信任作者並了解其運作方式的情況下購買或使用腳本。您也可以在我們的社群腳本中找到免費的開源替代方案。
作者的說明
Access this indicator here: patreon.com/user?u=80987417
Link Tree: linktr.ee/tradersendeavors
Access our indicators: patreon.com/user?u=80987417
Access our indicators: patreon.com/user?u=80987417
免責聲明
這些資訊和出版物並非旨在提供,也不構成TradingView提供或認可的任何形式的財務、投資、交易或其他類型的建議或推薦。請閱讀使用條款以了解更多資訊。