PROTECTED SOURCE SCRIPT
Fibonacci Seviyeleri - Özelleştirilebilir
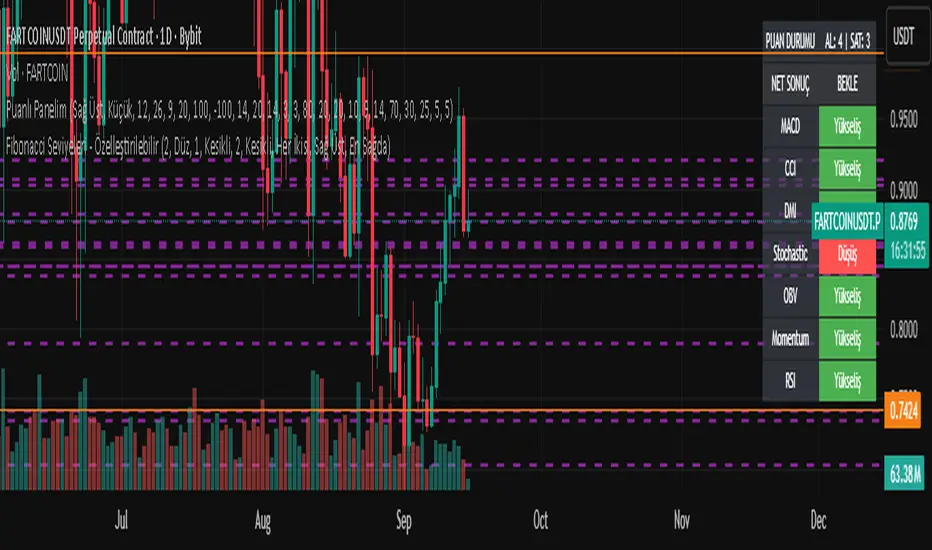
Fibonacci Levels & Technical Analysis Dashboard
Overview
This Pine Script indicator combines comprehensive Fibonacci level analysis with a technical indicators scoring system, presenting all information in a clean, dual-table layout directly on your TradingView chart.
Key Features
1. Fibonacci Levels Analysis
Daily Fibonacci Levels: Calculates and displays key Fibonacci retracement and extension levels based on the previous day's price range
Weekly Fibonacci Levels: Provides weekly Fibonacci levels for longer-term analysis
Monday Plan Option: Alternative weekly calculation starting from Monday's data
Real-time Updates: All levels update automatically at the start of each new period
2. Technical Indicators Scoring System
The indicator analyzes 7 major technical indicators and provides buy/sell signals:
RSI (Relative Strength Index): Momentum oscillator for overbought/oversold conditions
MACD: Trend-following momentum indicator
Stochastic: Momentum indicator comparing closing price to price range
CCI (Commodity Channel Index): Measures deviation from average price
DMI (Directional Movement Index): Trend strength indicator
OBV (On Balance Volume): Volume-based momentum indicator
Momentum: Rate of price change indicator
3. Visual Components
Chart Lines and Labels
Horizontal lines drawn at each Fibonacci level
Optional price labels showing exact level values
Customizable line styles (solid, dashed, dotted)
Adjustable line thickness and colors
Lines extend to the right for easy tracking
Dual Table Display
Left Table: Fibonacci levels with prices
Right Table: Technical indicators with signals and scoring
Tables can be positioned (top/middle/bottom and left/center/right)
Clean, professional appearance with customizable colors
How to Use
Basic Setup
Add the indicator to your chart
The default settings work well for most trading scenarios
Two tables will appear showing Fibonacci levels and technical signals
Customization Options
Fibonacci Settings
Show Daily/Weekly: Toggle which Fibonacci levels to display
Monday Plan: Enable for weekly levels based on Monday's data
Show Labels: Toggle price labels on chart
Line Styles: Choose between solid, dashed, or dotted lines
Colors: Customize colors for different level types
Technical Indicators
Adjust period settings for each indicator (RSI, MACD, etc.)
Fine-tune sensitivity for better signals on your specific instrument
Display Options
Table Position: Place tables where convenient on your chart
Show/Hide Elements: Toggle individual components as needed
Trading Applications
Fibonacci Level Trading
Support/Resistance: Use Fibonacci levels as potential support and resistance zones
Entry Points: Look for price reactions at key levels (0.236, 0.382, 0.618)
Target Setting: Use extension levels (1.618, 2.618) for profit targets
Stop Loss Placement: Place stops beyond key Fibonacci levels
Signal Interpretation
Strong Buy Signal: Score ≥ 4 (majority of indicators bullish)
Buy Signal: Score between 1 and 3 (lean bullish)
Neutral/Wait: Score = 0 (mixed signals)
Sell Signal: Score between -1 and -3 (lean bearish)
Strong Sell Signal: Score ≤ -4 (majority of indicators bearish)
Combined Analysis
Confluence Trading: Look for technical signals at Fibonacci levels
Confirmation: Use indicator signals to confirm Fibonacci level breaks
Risk Management: Use both systems to validate trade entries and exits
Best Practices
Multiple Timeframes: Compare daily and weekly Fibonacci levels for stronger zones
Volume Confirmation: Pay attention to OBV signals at key levels
Trend Alignment: Use DMI to confirm trend direction before trading levels
Patience: Wait for clear signals rather than forcing trades
Risk Management: Always use stop losses, especially when trading against the signal score
Tips for Optimal Use
Clean Charts: Hide elements you don't need to reduce clutter
Color Coding: Use contrasting colors for better visibility
Regular Monitoring: Check both tables at market open for daily planning
Backtesting: Test the indicator's signals on historical data before live trading
Combine with Price Action: Use candlestick patterns at Fibonacci levels for confirmation
Technical Notes
The indicator updates in real-time with price movements
Fibonacci calculations use traditional ratios (0.236, 0.382, 0.5, 0.618, etc.)
All technical indicators use standard calculation methods
The scoring system weights each indicator equally (1 point per indicator)
Historical levels remain visible for reference until new periods begin
Conclusion
This indicator provides a comprehensive trading dashboard combining classical Fibonacci analysis with modern technical indicators. It's designed for traders who want quick, actionable insights without switching between multiple indicators or performing manual calculations. The dual-table format keeps all essential information visible while maintaining a clean chart appearance.
Whether you're a day trader using daily Fibonacci levels or a swing trader focusing on weekly levels, this indicator adapts to your trading style while providing consistent, reliable technical analysis signals.
受保護腳本
此腳本以閉源形式發佈。 不過,您可以自由使用,沒有任何限制 — 點擊此處了解更多。
免責聲明
這些資訊和出版物並非旨在提供,也不構成TradingView提供或認可的任何形式的財務、投資、交易或其他類型的建議或推薦。請閱讀使用條款以了解更多資訊。
受保護腳本
此腳本以閉源形式發佈。 不過,您可以自由使用,沒有任何限制 — 點擊此處了解更多。
免責聲明
這些資訊和出版物並非旨在提供,也不構成TradingView提供或認可的任何形式的財務、投資、交易或其他類型的建議或推薦。請閱讀使用條款以了解更多資訊。