OPEN-SOURCE SCRIPT
已更新 Weekly Levels Prep (Smart Weekly Candle)
This script draws key weekly levels based on the most recent completed weekly candle (Monday–Friday). It automatically calculates and plots:
✅ Weekly High & Low
✅ Midpoint (50% level)
✅ Extension levels above and below
All levels are dynamically updated every new week and are visually marked with clean color-coded horizontal lines. Price values are shown near the price axis for clear visibility across all timeframes.
Great for:
Weekly preparation
Swing trading setups
Mean reversion and range breakouts
🔄 Works on all timeframes
🔍 Lightweight and non-intrusive
Built by a trader, for traders. 💼📈
發行說明
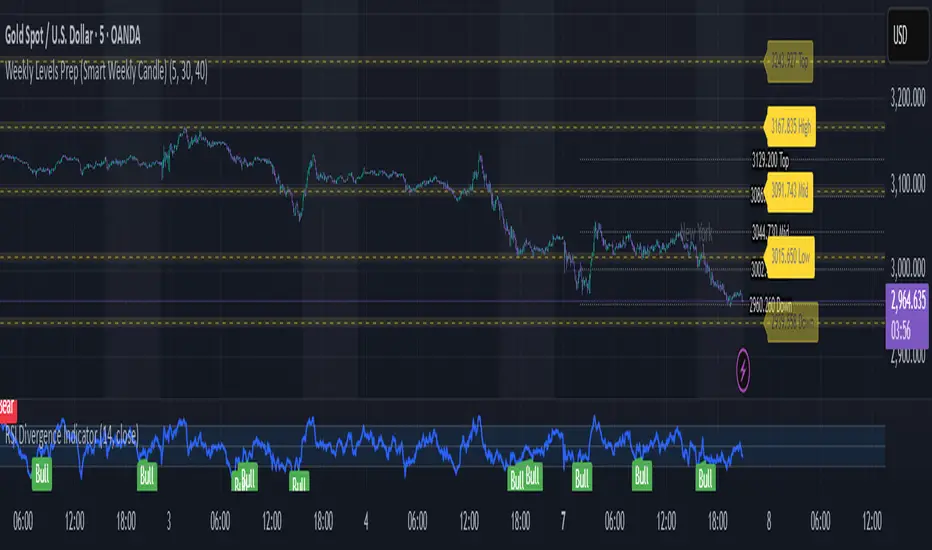
📊 Weekly Levels Prep (Smart Weekly Candle)This indicator highlights key weekly levels to help you prepare for the upcoming trading week with clarity and structure.
✅ Features:
Draws the most recent completed weekly candle's High, Low, Mid (50%), and two extension levels (Top & Down).
Adds a second set of levels (dotted gray lines) from the previous week's candle, helping you track historical reactions.
All levels are clearly labeled and positioned dynamically to stay readable.
New York trading session is visually highlighted with optional background shading and label.
Perfect for swing traders, intraday setups, and weekly analysis.
Adapted for any timeframe and includes weekend logic for accurate preparation.
發行說明
This script draws key weekly levels based on the most recent completed weekly candle (Monday–Friday). It automatically calculates and plots:✅ Weekly High & Low
✅ Midpoint (50% level)
✅ Extension levels above and below
All levels are dynamically updated every new week and are visually marked with clean color-coded horizontal lines. Price values are shown near the price axis for clear visibility across all timeframes.
Great for:
Weekly preparation
Swing trading setups
Mean reversion and range breakouts
🔄 Works on all timeframes
🔍 Lightweight and non-intrusive
Built by a trader, for traders. 💼📈
19 hours ago
Release Notes
📊 Weekly Levels Prep (Smart Weekly Candle)
This indicator highlights key weekly levels to help you prepare for the upcoming trading week with clarity and structure.
✅ Features:
Draws the most recent completed weekly candle's High, Low, Mid (50%), and two extension levels (Top & Down).
Adds a second set of levels (dotted gray lines) from the previous week's candle, helping you track historical reactions.
All levels are clearly labeled and positioned dynamically to stay readable.
New York trading session is visually highlighted with optional background shading and label.
Perfect for swing traders, intraday setups, and weekly analysis.
Adapted for any timeframe and includes weekend logic for accurate preparation.
24 minutes ago
Release Notes
This script draws key weekly levels based on the most recent completed weekly candle (Monday–Friday). It automatically calculates and plots:
✅ Weekly High & Low
✅ Midpoint (50% level)
✅ Extension levels above and below
All levels are dynamically updated every new week and are visually marked with clean color-coded horizontal lines. Price values are shown near the price axis for clear visibility across all timeframes.
Great for:
Weekly preparation
Swing trading setups
Mean reversion and range breakouts
🔄 Works on all timeframes
🔍 Lightweight and non-intrusive
Built by a trader, for traders. 💼📈
yesterday
Release Notes
📊 Weekly Levels Prep (Smart Weekly Candle)
This indicator highlights key weekly levels to help you prepare for the upcoming trading week with clarity and structure.
✅ Features:
Draws the most recent completed weekly candle's High, Low, Mid (50%), and two extension levels (Top & Down).
Adds a second set of levels (dotted gray lines) from the previous week's candle, helping you track historical reactions.
All levels are clearly labeled and positioned dynamically to stay readable.
New York trading session is visually highlighted with optional background shading and label.
Perfect for swing traders, intraday setups, and weekly analysis.
Adapted for any timeframe and includes weekend logic for accurate preparation.
13 hours ago
Release Notes
This script draws key weekly levels based on the most recent completed weekly candle (Monday–Friday). It automatically calculates and plots:
✅ Weekly High & Low
✅ Midpoint (50% level)
✅ Extension levels above and below
All levels are dynamically updated every new week and are visually marked with clean color-coded horizontal lines. Price values are shown near the price axis for clear visibility across all timeframes.
Great for:
Weekly preparation
Swing trading setups
Mean reversion and range breakouts
🔄 Works on all timeframes
🔍 Lightweight and non-intrusive
Built by a trader, for traders. 💼📈
19 hours ago
Release Notes
📊 Weekly Levels Prep (Smart Weekly Candle)
This indicator highlights key weekly levels to help you prepare for the upcoming trading week with clarity and structure.
✅ Features:
Draws the most recent completed weekly candle's High, Low, Mid (50%), and two extension levels (Top & Down).
Adds a second set of levels (dotted gray lines) from the previous week's candle, helping you track historical reactions.
All levels are clearly labeled and positioned dynamically to stay readable.
New York trading session is visually highlighted with optional background shading and label.
Perfect for swing traders, intraday setups, and weekly analysis.
Adapted for any timeframe and includes weekend logic for accurate preparation.
發行說明
This script draws key weekly levels based on the most recent completed weekly candle (Monday–Friday). It automatically calculates and plots:✅ Weekly High & Low
✅ Midpoint (50% level)
✅ Extension levels above and below
All levels are dynamically updated every new week and are visually marked with clean color-coded horizontal lines. Price values are shown near the price axis for clear visibility across all timeframes.
Great for:
Weekly preparation
Swing trading setups
Mean reversion and range breakouts
🔄 Works on all timeframes
🔍 Lightweight and non-intrusive
Built by a trader, for traders. 💼📈
19 hours ago
Release Notes
📊 Weekly Levels Prep (Smart Weekly Candle)
This indicator highlights key weekly levels to help you prepare for the upcoming trading week with clarity and structure.
✅ Features:
Draws the most recent completed weekly candle's High, Low, Mid (50%), and two extension levels (Top & Down).
Adds a second set of levels (dotted gray lines) from the previous week's candle, helping you track historical reactions.
All levels are clearly labeled and positioned dynamically to stay readable.
New York trading session is visually highlighted with optional background shading and label.
Perfect for swing traders, intraday setups, and weekly analysis.
Adapted for any timeframe and includes weekend logic for accurate preparation.
開源腳本
秉持TradingView一貫精神,這個腳本的創作者將其設為開源,以便交易者檢視並驗證其功能。向作者致敬!您可以免費使用此腳本,但請注意,重新發佈代碼需遵守我們的社群規範。
免責聲明
這些資訊和出版物並非旨在提供,也不構成TradingView提供或認可的任何形式的財務、投資、交易或其他類型的建議或推薦。請閱讀使用條款以了解更多資訊。
開源腳本
秉持TradingView一貫精神,這個腳本的創作者將其設為開源,以便交易者檢視並驗證其功能。向作者致敬!您可以免費使用此腳本,但請注意,重新發佈代碼需遵守我們的社群規範。
免責聲明
這些資訊和出版物並非旨在提供,也不構成TradingView提供或認可的任何形式的財務、投資、交易或其他類型的建議或推薦。請閱讀使用條款以了解更多資訊。