PROTECTED SOURCE SCRIPT
已更新 Expected Move Bands
Expected Moves
The Expected Move of a security shows the amount that a stock is expected to rise or fall from its current market price based on its level of volatility or implied volatility. The expected move of a stock is usually measured with standard deviations.
An Expected Move Range of 1 SD shows that price will be near the 1 SD range 68% of the time given enough samples.
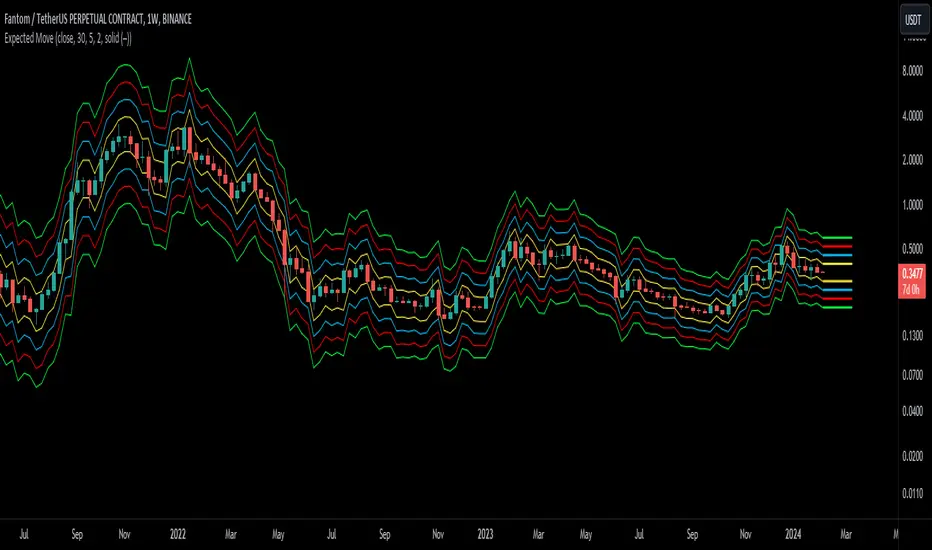
Expected Move Bands
This indicator gets the Expected Move for 1-4 Standard Deviation Ranges using Historical Volatility. Then it displays it on price as bands.
The Expected Move indicator also allows you to see MTF Expected Moves if you want to.
This indicator calculates the expected price movements by analyzing the historical volatility of an asset. Volatility is the measure of fluctuation.
This script uses log returns for the historical volatility calculation which can be modelled as a normal distribution most of the time meaning it is symmetrical and stationary unlike other scripts that use bands to find "reversals". They are fundamentally incorrect.
What these ranges tell you is basically the odds of the price movement being between these levels.
If you take enough samples, 95.5% of the them will be near the 2nd Standard Deviation. And so on. (The 3rd Standard deviation is 99.7%)
For higher timeframes you might need a smaller sample size.
Features


The Expected Move of a security shows the amount that a stock is expected to rise or fall from its current market price based on its level of volatility or implied volatility. The expected move of a stock is usually measured with standard deviations.
An Expected Move Range of 1 SD shows that price will be near the 1 SD range 68% of the time given enough samples.
Expected Move Bands
This indicator gets the Expected Move for 1-4 Standard Deviation Ranges using Historical Volatility. Then it displays it on price as bands.
The Expected Move indicator also allows you to see MTF Expected Moves if you want to.
This indicator calculates the expected price movements by analyzing the historical volatility of an asset. Volatility is the measure of fluctuation.
This script uses log returns for the historical volatility calculation which can be modelled as a normal distribution most of the time meaning it is symmetrical and stationary unlike other scripts that use bands to find "reversals". They are fundamentally incorrect.
What these ranges tell you is basically the odds of the price movement being between these levels.
If you take enough samples, 95.5% of the them will be near the 2nd Standard Deviation. And so on. (The 3rd Standard deviation is 99.7%)
For higher timeframes you might need a smaller sample size.
Features
- MTF Option
- Parameter customization
發行說明
Improved the volatility calculations.受保護腳本
此腳本以閉源形式發佈。 不過,您可以自由使用,沒有任何限制 — 點擊此處了解更多。
Link Tree: linktr.ee/tradersendeavors
Access our indicators: patreon.com/user?u=80987417
Access our indicators: patreon.com/user?u=80987417
免責聲明
這些資訊和出版物並非旨在提供,也不構成TradingView提供或認可的任何形式的財務、投資、交易或其他類型的建議或推薦。請閱讀使用條款以了解更多資訊。
受保護腳本
此腳本以閉源形式發佈。 不過,您可以自由使用,沒有任何限制 — 點擊此處了解更多。
Link Tree: linktr.ee/tradersendeavors
Access our indicators: patreon.com/user?u=80987417
Access our indicators: patreon.com/user?u=80987417
免責聲明
這些資訊和出版物並非旨在提供,也不構成TradingView提供或認可的任何形式的財務、投資、交易或其他類型的建議或推薦。請閱讀使用條款以了解更多資訊。