INVITE-ONLY SCRIPT
已更新 LIB: Pi Cycle Top Indicator
Indicator Overview
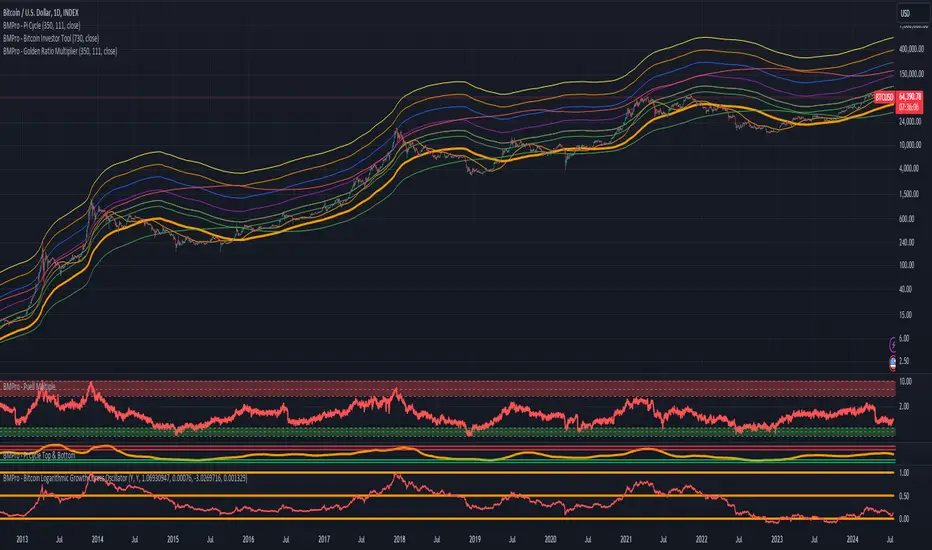
The Pi Cycle Top Indicator has historically been effective in picking out the timing of market cycle highs to within 3 days.
It uses the 111 day moving average (111DMA) and a newly created multiple of the 350 day moving average, the 350DMA x 2.
Note: The multiple is of the price values of the 350DMA not the number of days.
For the past three market cycles, when the 111DMA moves up and crosses the 350DMA x 2 we see that it coincides with the price of Bitcoin peaking.
It is also interesting to note that 350 / 111 is 3.153, which is very close to Pi = 3.142. In fact, it is the closest we can get to Pi when dividing 350 by another whole number.
It once again demonstrates the cyclical nature of Bitcoin price action over long time frames. Though in this instance it does so with a high degree of accuracy over the past 7 years.
How It Can Be Used
Pi Cycle Top is useful to indicate when the market is very overheated. So overheated that the shorter term moving average of the 111day moving average has reached a x2 multiple of the 350 day moving average. Historically this has been a very good time to sell Bitcoin.
Created By
發行說明
The Pi Cycle Top Indicator forecasts the cycle top of Bitcoin’s market cycles. It attempts to predict the point where Bitcoin price will peak before pulling back. It does this on major high time frames and has picked the absolute tops of Bitcoin’s major price moves throughout most of its history.Pi Cycle Top is useful to indicate when the market is very overheated. So overheated that the shorter term moving average, which is the 111 day moving average, has reached a x2 multiple of the 350 day moving average. Historically it has proved advantageous to consider profit taking at this time in Bitcoin's price cycles.
僅限邀請腳本
只有經作者批准的使用者才能訪問此腳本。您需要申請並獲得使用權限。該權限通常在付款後授予。如欲了解更多詳情,請依照以下作者的說明操作,或直接聯絡BitcoinMagazinePro。
除非您完全信任其作者並了解腳本的工作原理,否則TradingView不建議您付費或使用腳本。您也可以在我們的社群腳本中找到免費的開源替代方案。
作者的說明
Your #1 source for Bitcoin analysis. Stay ahead of the trend. Go PRO with Bitcoin Magazine Pro!
https://www.bitcoinmagazinepro.com/
提醒:在請求訪問權限之前,請閱讀僅限邀請腳本指南。
免責聲明
這些資訊和出版物並不意味著也不構成TradingView提供或認可的金融、投資、交易或其他類型的意見或建議。請在使用條款閱讀更多資訊。