OPEN-SOURCE SCRIPT
Advanced Averaged Momentum Indicator (AAMI)
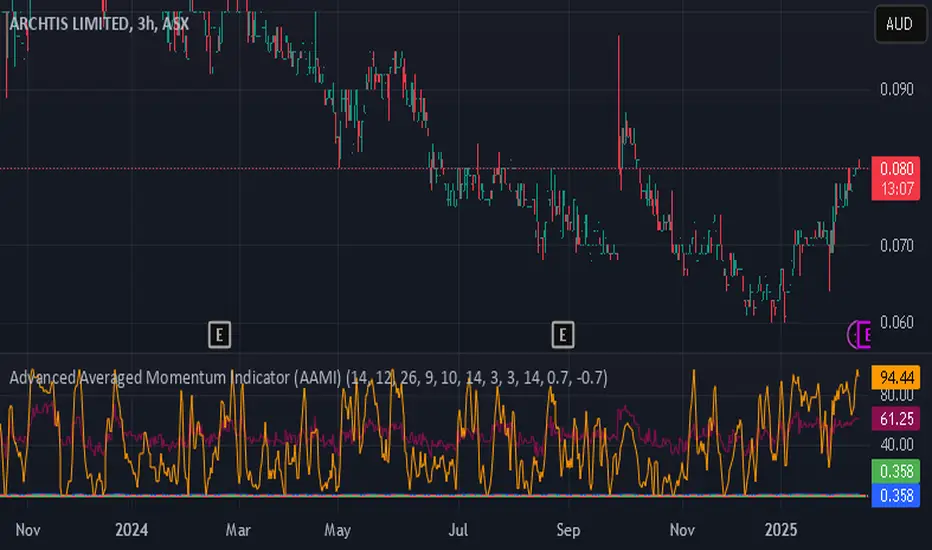
Key Features of AAMI:
Combination of Momentum Indicators: It averages normalized values from RSI, MACD histogram, raw Momentum, and Stochastic oscillator to give a comprehensive view of momentum.
Normalization: Each component is normalized to a scale from -1 to 1 to ensure they contribute equally to the AMI calculation.
Visual Cues: The indicator includes visual levels for neutral, overbought, and oversold conditions to aid in quick decision-making.
Alerts: Basic alert conditions are included for when AMI moves into overbought or oversold territory, which traders can customize further.
Customizable: All parameters can be adjusted within TradingView to tailor the indicator to different market conditions or trading strategies.
Smoothing: Included an SMA for AMI to reduce noise and give smoother signals.
Divergence Detection: Implemented a basic divergence detection mechanism to spot potential reversals.
Usage Tips:
Overbought/Oversold: When AMI goes above 0.7, it might suggest an overbought condition, potentially signaling a sell or take profit. Below -0.7 might indicate oversold conditions, suggesting a buy opportunity.
Divergence: Watch for divergences between the AMI and price action for signals of potential trend reversals.
Crossing Zero: The AMI crossing from negative to positive might be used as a buy signal, and vice versa for a sell signal.
This script provides a new way to view momentum by consolidating multiple traditional indicators into one, potentially offering clearer signals in complex market environments.
開源腳本
秉持TradingView一貫精神,這個腳本的創作者將其設為開源,以便交易者檢視並驗證其功能。向作者致敬!您可以免費使用此腳本,但請注意,重新發佈代碼需遵守我們的社群規範。
免責聲明
這些資訊和出版物並非旨在提供,也不構成TradingView提供或認可的任何形式的財務、投資、交易或其他類型的建議或推薦。請閱讀使用條款以了解更多資訊。
開源腳本
秉持TradingView一貫精神,這個腳本的創作者將其設為開源,以便交易者檢視並驗證其功能。向作者致敬!您可以免費使用此腳本,但請注意,重新發佈代碼需遵守我們的社群規範。
免責聲明
這些資訊和出版物並非旨在提供,也不構成TradingView提供或認可的任何形式的財務、投資、交易或其他類型的建議或推薦。請閱讀使用條款以了解更多資訊。