OPEN-SOURCE SCRIPT
已更新 Display MB on Bars
Description
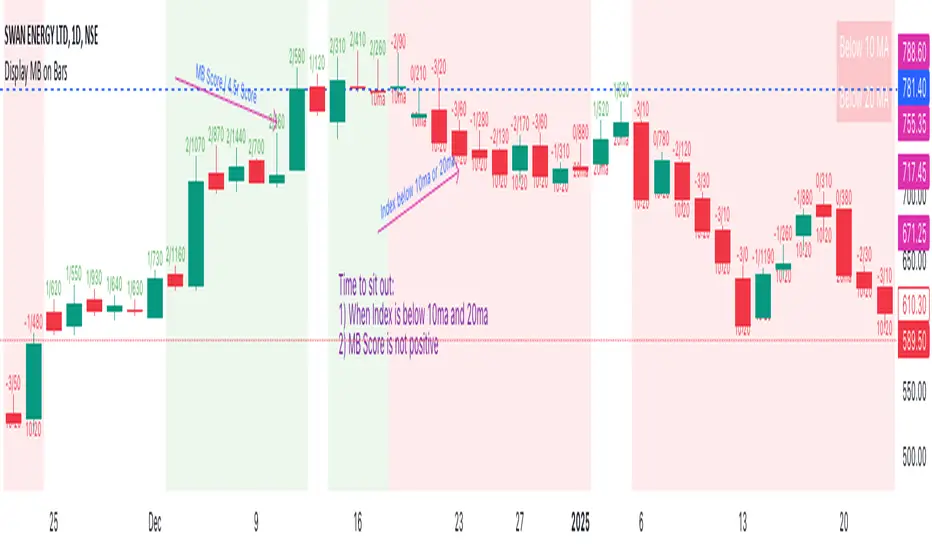
The "Display MB on Bars" Pine Script indicator is designed to visually represent Market Breadth values and R4.5 scores on trading charts. This script enables traders to highlight and analyze key market behavior using pre-defined thresholds for MB scores and dynamically calculated R4.5 values. Additionally, it includes a moving average status table to assess price levels relative to the 10-day and 20-day moving averages.
Features:
1. COB Date Matching: Displays data corresponding to specific "COB dates" provided by the user.
2. MB Value Visualization:
o Highlights bars with a background color based on MB values:
Red if MB ≤ MB_Red (default: -1).
Green if MB ≥ MB_Green (default: 3).
3. R4.5 Scores Display:
o Creates a label on the chart with the MB and R4.5 values when conditions are met (e.g., R4.5 > 200 or specific MB thresholds).
4. Index Moving Average Comparison:
o Calculates 10-day and 20-day moving averages for the selected symbol (default: NSE:NIFTYMIDSML400).
o Shows the price position relative to these moving averages in a table.
How to Use:
1. Configure Inputs:
o COB Dates: Enter a comma-separated list of dates in the format DD-MM-YYYY.
o MB Values: Provide the corresponding MB scores for the COB dates.
o R4.5 Values: Provide the R4.5 scores for the COB dates.
o Set the thresholds for MB values (MB Red<= and MB Green>=).
o Toggle features like MB, RS (R4.5), and the moving average status table.
2. Interpret the Output:
o Observe background colors on the bars:
Red: Indicates MB is less than or equal to the lower threshold.
Green: Indicates MB exceeds the upper threshold.
o Check labels above bars for R4.5 and MB values when conditions are met.
o Refer to the status table on the top-right corner to understand price positions relative to 10-day and 20-day moving averages.
This script is especially useful for traders seeking insights into custom metrics like MB and R4.5, enabling quick identification of key patterns and trends in the market.
發行說明
Additional inputs for MA 開源腳本
秉持TradingView一貫精神,這個腳本的創作者將其設為開源,以便交易者檢視並驗證其功能。向作者致敬!您可以免費使用此腳本,但請注意,重新發佈代碼需遵守我們的社群規範。
免責聲明
這些資訊和出版物並非旨在提供,也不構成TradingView提供或認可的任何形式的財務、投資、交易或其他類型的建議或推薦。請閱讀使用條款以了解更多資訊。
開源腳本
秉持TradingView一貫精神,這個腳本的創作者將其設為開源,以便交易者檢視並驗證其功能。向作者致敬!您可以免費使用此腳本,但請注意,重新發佈代碼需遵守我們的社群規範。
免責聲明
這些資訊和出版物並非旨在提供,也不構成TradingView提供或認可的任何形式的財務、投資、交易或其他類型的建議或推薦。請閱讀使用條款以了解更多資訊。