OPEN-SOURCE SCRIPT
Tomas Ratio Strategy with Multi-Timeframe Analysis
Hello,
I would like to present my new indicator I have compiled together inspired by Calmar Ratio which is a ratio that measures gains vs losers but with a little twist.
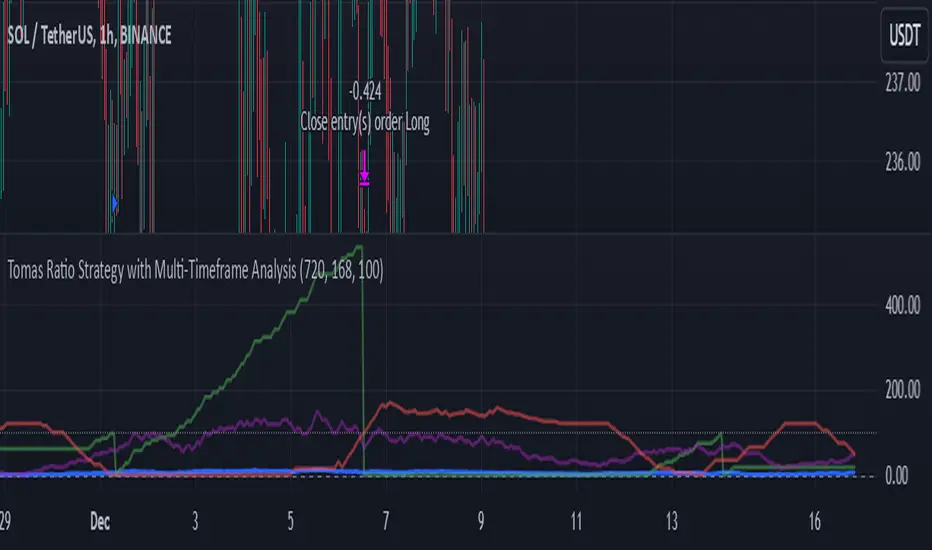
Basically the idea is that if HLC3 is above HLC3[1] (or previous one) it will count as a gain and it will calculate the percentage of winners in last 720 hourly bars and then apply 168 hour standard deviation to the weekly average daily gains.
The idea is that you're supposed to buy if the thick blue line goes up and not buy if it goes down (signalized by the signal line). I liked that idea a lot, but I wanted to add an option to fire open and close signals. I have also added a logic that it not open more trades in relation the purple line which shows confidence in buying.
As input I recommend only adjusting the amount of points required to fire a signal. Note that the lower amount you put, the more open trades it will allow (and vice versa)
Feel free to remove that limiter if you want to. It works without it as well, this script is meant for inexperienced eye.
I will also publish a indicator script with this limiter removed and alerts added for you to test this strategy if you so choose to.
Also, I have added that the trades will enter only if price is above 720 period EMA
Disclaimer
This strategy is for educational purposes only and should not be considered financial advice. Always backtest thoroughly and adjust parameters based on your trading style and market conditions.
Made in collaboration with ChatGPT.
I would like to present my new indicator I have compiled together inspired by Calmar Ratio which is a ratio that measures gains vs losers but with a little twist.
Basically the idea is that if HLC3 is above HLC3[1] (or previous one) it will count as a gain and it will calculate the percentage of winners in last 720 hourly bars and then apply 168 hour standard deviation to the weekly average daily gains.
The idea is that you're supposed to buy if the thick blue line goes up and not buy if it goes down (signalized by the signal line). I liked that idea a lot, but I wanted to add an option to fire open and close signals. I have also added a logic that it not open more trades in relation the purple line which shows confidence in buying.
As input I recommend only adjusting the amount of points required to fire a signal. Note that the lower amount you put, the more open trades it will allow (and vice versa)
Feel free to remove that limiter if you want to. It works without it as well, this script is meant for inexperienced eye.
I will also publish a indicator script with this limiter removed and alerts added for you to test this strategy if you so choose to.
Also, I have added that the trades will enter only if price is above 720 period EMA
Disclaimer
This strategy is for educational purposes only and should not be considered financial advice. Always backtest thoroughly and adjust parameters based on your trading style and market conditions.
Made in collaboration with ChatGPT.
開源腳本
秉持TradingView一貫精神,這個腳本的創作者將其設為開源,以便交易者檢視並驗證其功能。向作者致敬!您可以免費使用此腳本,但請注意,重新發佈代碼需遵守我們的社群規範。
免責聲明
這些資訊和出版物並非旨在提供,也不構成TradingView提供或認可的任何形式的財務、投資、交易或其他類型的建議或推薦。請閱讀使用條款以了解更多資訊。
開源腳本
秉持TradingView一貫精神,這個腳本的創作者將其設為開源,以便交易者檢視並驗證其功能。向作者致敬!您可以免費使用此腳本,但請注意,重新發佈代碼需遵守我們的社群規範。
免責聲明
這些資訊和出版物並非旨在提供,也不構成TradingView提供或認可的任何形式的財務、投資、交易或其他類型的建議或推薦。請閱讀使用條款以了解更多資訊。