OPEN-SOURCE SCRIPT
MTF FVGs [Fadi x MMT]

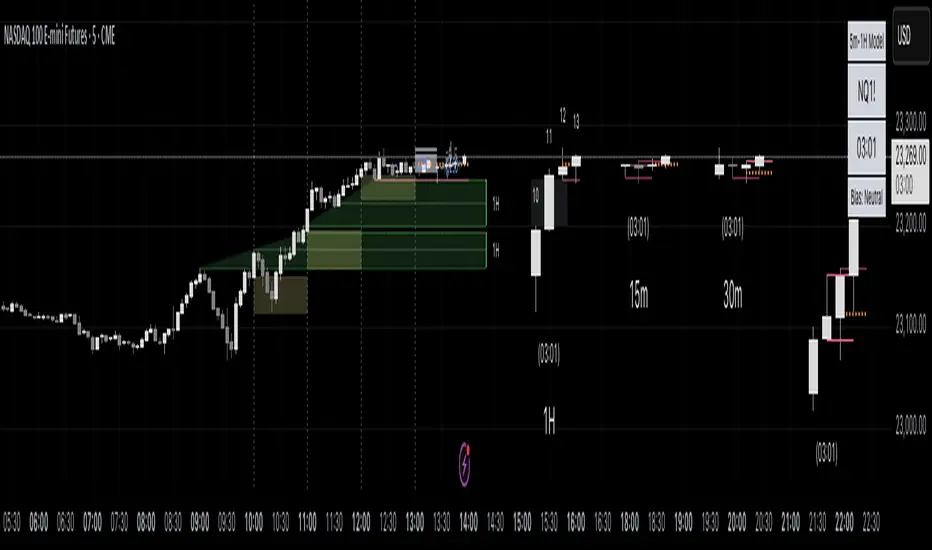
The MTF FVGs [Fadi x MMT] indicator is a powerful tool for identifying and visualizing Fair Value Gaps (FVGs) across multiple timeframes on TradingView. It provides traders with customizable options to display bullish and bearish FVGs, control their appearance, and manage mitigated gaps, making it ideal for price action and imbalance-based trading strategies.
Features
Settings
Higher Timeframe (HTF) FVG Settings
Display Settings
Mitigation Settings
Labeling Settings
Advanced Settings
How to Use
Features
- Multi-Timeframe Support: Analyzes FVGs on up to seven timeframes, including an auto-adjusted timeframe and user-defined periods (e.g., 5m, 15m, 1H, 4H, 1D, 1W).
- Customizable Display: Toggle visibility of FVG open, close, central equilibrium (C.E.), and connecting lines with adjustable styles (solid, dashed, dotted) and sizes.
- Background Fill: Option to fill FVG areas with customizable transparency for better visualization.
- Mitigation Settings: Show or hide mitigated FVGs with configurable mitigation criteria (e.g., touched, wick-filled, body-filled) and extend mitigated lines.
- Labeling Options: Display labels for timeframes, FVG types (BISI/SIBI), and levels (open, close, C.E.) with customizable colors and sizes.
- Proximity Filtering: Hide FVGs outside a specified price range based on daily or monthly ATR for cleaner charts.
- Timeframe Filtering: Hide lower or current timeframe FVGs to focus on higher timeframe imbalances.
- Performance Optimization: Limits the number of displayed FVGs and supports up to 5000 bars back, 500 lines, labels, and boxes.
Settings
Higher Timeframe (HTF) FVG Settings
- Show/Hide: Enable or disable FVGs for each timeframe.
- Timeframe Selection: Choose specific timeframes (e.g., 5m, 15m, 1H, 4H, 1D, 1W) or use auto-selection based on the current chart.
- Colors: Set bullish (default: green) and bearish (default: red) FVG colors.
- Max Count: Limit the number of FVGs displayed per timeframe (default: 5).
Display Settings
- Open/Close Lines: Toggle visibility, style (solid, dashed, dotted), and size (1-4) for FVG boundaries.
- Central Equilibrium (C.E.): Show/hide the midpoint line with customizable style, size, and colors (default: white with transparency).
- Link Line: Display a connecting line between FVG boundaries with adjustable style and size.
- Background Transparency: Enable/disable fill between FVG boundaries with adjustable transparency (50%-98%).
Mitigation Settings
- Show Mitigated FVGs: Toggle visibility of mitigated gaps.
- Mitigation Type: Choose criteria for mitigation (None, Touched, Wick Filled, Body Filled, Wick Filled Half, Body Filled Half).
- Mitigated Colors: Set colors for mitigated bullish and bearish FVGs (default: gray with transparency).
- Extend Mitigated Lines: Extend mitigated FVG lines by a specified number of bars (default: 5).
Labeling Settings
- Label Display: Toggle labels for FVGs with customizable color, background color, and size (tiny, small, normal, large, huge).
- Label Levels: Show labels for open, close, or C.E. levels.
- Label Content: Include timeframe, FVG type (BISI/SIBI), or level information in labels.
Advanced Settings
- Proximity Filter: Hide FVGs outside a price range based on daily ATR (adjustable factor: 1-10).
- Label Combine Factor: Control label visibility to avoid clutter (default: 1.0).
- ATR Range: Set the number of candles for ATR calculation (default: 10).
- Line Extension: Extend FVG lines by a set number of bars (default: 4) or based on price range conditions.
- Timeframe Spacing: Adjust spacing between FVGs from different timeframes (default: 4 bars).
How to Use
- Add the indicator to your TradingView chart.
- Configure the desired timeframes and settings via the indicator's input menu.
- Analyze FVGs to identify potential support/resistance zones or imbalance areas for trading decisions.
- Use mitigation settings to track filled gaps and proximity filters to focus on relevant price levels.
開源腳本
本著TradingView的真正精神,此腳本的創建者將其開源,以便交易者可以查看和驗證其功能。向作者致敬!雖然您可以免費使用它,但請記住,重新發佈程式碼必須遵守我們的網站規則。
免責聲明
這些資訊和出版物並不意味著也不構成TradingView提供或認可的金融、投資、交易或其他類型的意見或建議。請在使用條款閱讀更多資訊。
開源腳本
本著TradingView的真正精神,此腳本的創建者將其開源,以便交易者可以查看和驗證其功能。向作者致敬!雖然您可以免費使用它,但請記住,重新發佈程式碼必須遵守我們的網站規則。
免責聲明
這些資訊和出版物並不意味著也不構成TradingView提供或認可的金融、投資、交易或其他類型的意見或建議。請在使用條款閱讀更多資訊。