FvgCalculations█ OVERVIEW
This library provides the core calculation engine for identifying Fair Value Gaps (FVGs) across different timeframes and for processing their interaction with price. It includes functions to detect FVGs on both the current chart and higher timeframes, as well as to check for their full or partial mitigation.
█ CONCEPTS
The library's primary functions revolve around the concept of Fair Value Gaps and their lifecycle.
Fair Value Gap (FVG) Identification
An FVG, or imbalance, represents a price range where buying or selling pressure was significant enough to cause a rapid price movement, leaving an "inefficiency" in the market. This library identifies FVGs based on three-bar patterns:
Bullish FVG: Forms when the low of the current bar (bar 3) is higher than the high of the bar two periods prior (bar 1). The FVG is the space between the high of bar 1 and the low of bar 3.
Bearish FVG: Forms when the high of the current bar (bar 3) is lower than the low of the bar two periods prior (bar 1). The FVG is the space between the low of bar 1 and the high of bar 3.
The library provides distinct functions for detecting FVGs on the current (Low Timeframe - LTF) and specified higher timeframes (Medium Timeframe - MTF / High Timeframe - HTF).
FVG Mitigation
Mitigation refers to price revisiting an FVG.
Full Mitigation: An FVG is considered fully mitigated when price completely closes the gap. For a bullish FVG, this occurs if the current low price moves below or touches the FVG's bottom. For a bearish FVG, it occurs if the current high price moves above or touches the FVG's top.
Partial Mitigation (Entry/Fill): An FVG is partially mitigated when price enters the FVG's range but does not fully close it. The library tracks the extent of this fill. For a bullish FVG, if the current low price enters the FVG from above, that low becomes the new effective top of the remaining FVG. For a bearish FVG, if the current high price enters the FVG from below, that high becomes the new effective bottom of the remaining FVG.
FVG Interaction
This refers to any instance where the current bar's price range (high to low) touches or crosses into the currently unfilled portion of an active (visible and not fully mitigated) FVG.
Multi-Timeframe Data Acquisition
To detect FVGs on higher timeframes, specific historical bar data (high, low, and time of bars at indices and relative to the higher timeframe's last completed bar) is required. The requestMultiTFBarData function is designed to fetch this data efficiently.
█ CALCULATIONS AND USE
The functions in this library are typically used in a sequence to manage FVGs:
1. Data Retrieval (for MTF/HTF FVGs):
Call requestMultiTFBarData() with the desired higher timeframe string (e.g., "60", "D").
This returns a tuple of htfHigh1, htfLow1, htfTime1, htfHigh3, htfLow3, htfTime3.
2. FVG Detection:
For LTF FVGs: Call detectFvg() on each confirmed bar. It uses high , low, low , and high along with barstate.isconfirmed.
For MTF/HTF FVGs: Call detectMultiTFFvg() using the data obtained from requestMultiTFBarData().
Both detection functions return an fvgObject (defined in FvgTypes) if an FVG is found, otherwise na. They also can classify FVGs as "Large Volume" (LV) if classifyLV is true and the FVG size (top - bottom) relative to the tfAtr (Average True Range of the respective timeframe) meets the lvAtrMultiplier.
3. FVG State Updates (on each new bar for existing FVGs):
First, check for overall price interaction using fvgInteractionCheck(). This function determines if the current bar's high/low has touched or entered the FVG's currentTop or currentBottom.
If interaction occurs and the FVG is not already mitigated:
Call checkMitigation() to determine if the FVG has been fully mitigated by the current bar's currentHigh and currentLow. If true, the FVG's isMitigated status is updated.
If not fully mitigated, call checkPartialMitigation() to see if the price has further entered the FVG. This function returns the newLevel to which the FVG has been filled (e.g., currentLow for a bullish FVG, currentHigh for bearish). This newLevel is then used to update the FVG's currentTop or currentBottom.
The calling script (e.g., fvgMain.c) is responsible for storing and managing the array of fvgObject instances and passing them to these update functions.
█ NOTES
Bar State for LTF Detection: The detectFvg() function relies on barstate.isconfirmed to ensure FVG detection is based on closed bars, preventing FVGs from being detected prematurely on the currently forming bar.
Higher Timeframe Data (lookahead): The requestMultiTFBarData() function uses lookahead = barmerge.lookahead_on. This means it can access historical data from the higher timeframe that corresponds to the current bar on the chart, even if the higher timeframe bar has not officially closed. This is standard for multi-timeframe analysis aiming to plot historical HTF data accurately on a lower timeframe chart.
Parameter Typing: Functions like detectMultiTFFvg and detectFvg infer the type for boolean (classifyLV) and numeric (lvAtrMultiplier) parameters passed from the main script, while explicitly typed series parameters (like htfHigh1, currentAtr) expect series data.
fvgObject Dependency: The FVG detection functions return fvgObject instances, and fvgInteractionCheck takes an fvgObject as a parameter. This UDT is defined in the FvgTypes library, making it a dependency for using FvgCalculations.
ATR for LV Classification: The tfAtr (for MTF/HTF) and currentAtr (for LTF) parameters are expected to be the Average True Range values for the respective timeframes. These are used, if classifyLV is enabled, to determine if an FVG's size qualifies it as a "Large Volume" FVG based on the lvAtrMultiplier.
MTF/HTF FVG Appearance Timing: When displaying FVGs from a higher timeframe (MTF/HTF) on a lower timeframe (LTF) chart, users might observe that the most recent MTF/HTF FVG appears one LTF bar later compared to its appearance on a native MTF/HTF chart. This is an expected behavior due to the detection mechanism in `detectMultiTFFvg`. This function uses historical bar data from the MTF/HTF (specifically, data equivalent to `HTF_bar ` and `HTF_bar `) to identify an FVG. Therefore, all three bars forming the FVG on the MTF/HTF must be fully closed and have shifted into these historical index positions relative to the `request.security` call from the LTF chart before the FVG can be detected and displayed on the LTF. This ensures that the MTF/HTF FVG is identified based on confirmed, closed bars from the higher timeframe.
█ EXPORTED FUNCTIONS
requestMultiTFBarData(timeframe)
Requests historical bar data for specific previous bars from a specified higher timeframe.
It fetches H , L , T (for the bar before last) and H , L , T (for the bar three periods prior)
from the requested timeframe.
This is typically used to identify FVG patterns on MTF/HTF.
Parameters:
timeframe (simple string) : The higher timeframe to request data from (e.g., "60" for 1-hour, "D" for Daily).
Returns: A tuple containing: .
- htfHigh1 (series float): High of the bar at index 1 (one bar before the last completed bar on timeframe).
- htfLow1 (series float): Low of the bar at index 1.
- htfTime1 (series int) : Time of the bar at index 1.
- htfHigh3 (series float): High of the bar at index 3 (three bars before the last completed bar on timeframe).
- htfLow3 (series float): Low of the bar at index 3.
- htfTime3 (series int) : Time of the bar at index 3.
detectMultiTFFvg(htfHigh1, htfLow1, htfTime1, htfHigh3, htfLow3, htfTime3, tfAtr, classifyLV, lvAtrMultiplier, tfType)
Detects a Fair Value Gap (FVG) on a higher timeframe (MTF/HTF) using pre-fetched bar data.
Parameters:
htfHigh1 (float) : High of the first relevant bar (typically high ) from the higher timeframe.
htfLow1 (float) : Low of the first relevant bar (typically low ) from the higher timeframe.
htfTime1 (int) : Time of the first relevant bar (typically time ) from the higher timeframe.
htfHigh3 (float) : High of the third relevant bar (typically high ) from the higher timeframe.
htfLow3 (float) : Low of the third relevant bar (typically low ) from the higher timeframe.
htfTime3 (int) : Time of the third relevant bar (typically time ) from the higher timeframe.
tfAtr (float) : ATR value for the higher timeframe, used for Large Volume (LV) FVG classification.
classifyLV (bool) : If true, FVGs will be assessed to see if they qualify as Large Volume.
lvAtrMultiplier (float) : The ATR multiplier used to define if an FVG is Large Volume.
tfType (series tfType enum from no1x/FvgTypes/1) : The timeframe type (e.g., types.tfType.MTF, types.tfType.HTF) of the FVG being detected.
Returns: An fvgObject instance if an FVG is detected, otherwise na.
detectFvg(classifyLV, lvAtrMultiplier, currentAtr)
Detects a Fair Value Gap (FVG) on the current (LTF - Low Timeframe) chart.
Parameters:
classifyLV (bool) : If true, FVGs will be assessed to see if they qualify as Large Volume.
lvAtrMultiplier (float) : The ATR multiplier used to define if an FVG is Large Volume.
currentAtr (float) : ATR value for the current timeframe, used for LV FVG classification.
Returns: An fvgObject instance if an FVG is detected, otherwise na.
checkMitigation(isBullish, fvgTop, fvgBottom, currentHigh, currentLow)
Checks if an FVG has been fully mitigated by the current bar's price action.
Parameters:
isBullish (bool) : True if the FVG being checked is bullish, false if bearish.
fvgTop (float) : The top price level of the FVG.
fvgBottom (float) : The bottom price level of the FVG.
currentHigh (float) : The high price of the current bar.
currentLow (float) : The low price of the current bar.
Returns: True if the FVG is considered fully mitigated, false otherwise.
checkPartialMitigation(isBullish, currentBoxTop, currentBoxBottom, currentHigh, currentLow)
Checks for partial mitigation of an FVG by the current bar's price action.
It determines if the price has entered the FVG and returns the new fill level.
Parameters:
isBullish (bool) : True if the FVG being checked is bullish, false if bearish.
currentBoxTop (float) : The current top of the FVG box (this might have been adjusted by previous partial fills).
currentBoxBottom (float) : The current bottom of the FVG box (similarly, might be adjusted).
currentHigh (float) : The high price of the current bar.
currentLow (float) : The low price of the current bar.
Returns: The new price level to which the FVG has been filled (e.g., currentLow for a bullish FVG).
Returns na if no new partial fill occurred on this bar.
fvgInteractionCheck(fvg, highVal, lowVal)
Checks if the current bar's price interacts with the given FVG.
Interaction means the price touches or crosses into the FVG's
current (possibly partially filled) range.
Parameters:
fvg (fvgObject type from no1x/FvgTypes/1) : The FVG object to check.
Its isMitigated, isVisible, isBullish, currentTop, and currentBottom fields are used.
highVal (float) : The high price of the current bar.
lowVal (float) : The low price of the current bar.
Returns: True if price interacts with the FVG, false otherwise.
Mtf

CSCMultiTimeframeToolsLibrary "CSCMultiTimeframeTools"
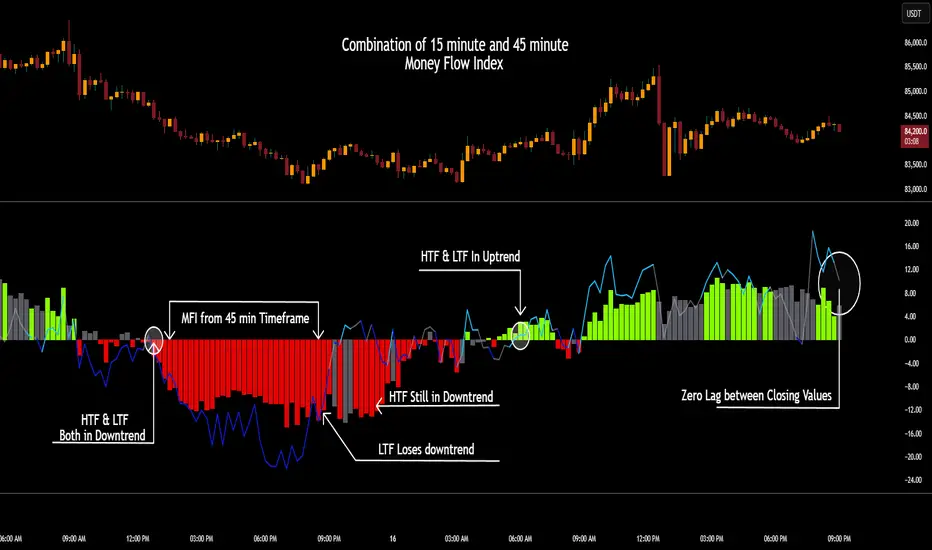
Calculates instant higher timeframe values for higher timeframe analysis with zero lag.
getAdjustedLookback(current_tf_minutes, higher_tf_minutes, length)
Calculate adjusted lookback period for higher timeframe conversion.
Parameters:
current_tf_minutes (int) : Current chart timeframe in minutes (e.g., 5 for 5m).
higher_tf_minutes (int) : Target higher timeframe in minutes (e.g., 15 for 15m).
length (int) : Base length value (e.g., 14 for RSI/MFI).
Returns: Adjusted lookback period (length × multiplier).
Purpose and Benefits of the TimeframeTools Library
This library is designed to solve a critical pain point for traders who rely on higher timeframe (HTF) indicator values while analyzing lower timeframe (LTF) charts. Traditional methods require waiting for multiple candles to close—for example, to see a 1-hour RSI on a 5-minute chart, you’d need 12 closed candles (5m × 12 = 60m) before the value updates. This lag means missed opportunities, delayed signals, and inefficient decision-making.
Why Traders Need This
Whether you’re scalping (5M/15M) or swing trading (1H/4H), this library bridges the gap between timeframes, giving you HTF context in real time—so you can act faster, with confidence.
How This Library Eliminates the Waiting Game
By dynamically calculating the adjusted lookback period, the library allows:
Real-time HTF values on LTF charts – No waiting for candle closes.
Accurate conversions – A 14-period RSI on a 1-hour chart translates to 168 periods (14 × 12) on a 5-minute chart, ensuring mathematical precision.
Flexible application – Works with common indicators like RSI, MFI, CCI, and moving averages (though confirmations should be done before publishing under your own secondary use).
Key Advantages Over Manual Methods
Speed: Instantly reflects HTF values without waiting for candle resolutions.
Adaptability: Adjusts automatically if the user changes timeframes or lengths.
Consistency: Removes human error in manual period calculations.
Limitations to Note
Not a magic bullet – While it solves the lag issue, traders should still:
Validate signals with price action or additional confirmations.
Be mindful of extreme lookback lengths (e.g., a 200-period daily SMA on a 1-minute chart requires 28,800 periods, which may strain performance).
MTFDataLibrary "MTFData"
Functions to store multi timeframe candle data and swing points.
getCandleData(timeframe, openArray, highArray, lowArray, closeArray, timeArray, olcLookback, alltfs_olcLookback, tfIndex)
Stores current or higher timeframe candle data in arrays.
Parameters:
timeframe (string) : The timeframe, for example "240" for 4h
openArray (array) : An array to store the candle open price
highArray (array) : An array to store the candle high price
lowArray (array) : An array to store the candle low price
closeArray (array) : An array to store the candle close price
timeArray (array) : An array to store the candle time
olcLookback (int) : The history reference of the lookback limiting candle
alltfs_olcLookback (array) : An array holding the candle time of olcLookback candles ago, which can be used for limiting lookbacks
tfIndex (int) : The timeframe's index in the alltfs_olcLookback array
Returns: true if the timeframe changed
trackHiLo(tfchange, timeframe, openArray, highArray, lowArray, closeArray, timeArray, highWickArray, highBodyArray, highTimeArray, lowWickArray, lowBodyArray, lowTimeArray, alltfs_olcLookback, tfIndex)
Stores current or higher timeframe swingpoint data into arrays.
Parameters:
tfchange (bool) : Must be true when the timeframe has changed (a new candle has opened)
timeframe (string) : The timeframe, for example "240" for 4h
openArray (array) : An array that stores the timeframe's candle open price
highArray (array) : An array that stores the timeframe's candle high price
lowArray (array) : An array that stores the timeframe's candle low price
closeArray (array) : An array that stores the timeframe's candle close price
timeArray (array) : An array that stores the timeframe's candle time
highWickArray (array) : An array to store the swing high price
highBodyArray (array) : An array to store the swing high's highest body price
highTimeArray (array) : An array to store the swing high candle's time
lowWickArray (array) : An array to store the swing low price
lowBodyArray (array) : An array to store the swing low's lowest body price
lowTimeArray (array) : An array to store the swing high candle's time
alltfs_olcLookback (array) : An array holding the time of the max allowed swing point age
tfIndex (int) : The timeframe's index in the alltfs_olcLookback array
Returns: Nothing. The array handling happens inside the function.
tfReadable(tfInSec)
Converts a timeframe string ("240") into a more readable string ("4h").
Parameters:
tfInSec (int) : The timeframe that should be converted, as timeframe.in_seconds()
Returns: A more readable timeframe string

real_time_candlesIntroduction
The Real-Time Candles Library provides comprehensive tools for creating, manipulating, and visualizing custom timeframe candles in Pine Script. Unlike standard indicators that only update at bar close, this library enables real-time visualization of price action and indicators within the current bar, offering traders unprecedented insight into market dynamics as they unfold.
This library addresses a fundamental limitation in traditional technical analysis: the inability to see how indicators evolve between bar closes. By implementing sophisticated real-time data processing techniques, traders can now observe indicator movements, divergences, and trend changes as they develop, potentially identifying trading opportunities much earlier than with conventional approaches.
Key Features
The library supports two primary candle generation approaches:
Chart-Time Candles: Generate real-time OHLC data for any variable (like RSI, MACD, etc.) while maintaining synchronization with chart bars.
Custom Timeframe (CTF) Candles: Create candles with custom time intervals or tick counts completely independent of the chart's native timeframe.
Both approaches support traditional candlestick and Heikin-Ashi visualization styles, with options for moving average overlays to smooth the data.
Configuration Requirements
For optimal performance with this library:
Set max_bars_back = 5000 in your script settings
When using CTF drawing functions, set max_lines_count = 500, max_boxes_count = 500, and max_labels_count = 500
These settings ensure that you will be able to draw correctly and will avoid any runtime errors.
Usage Examples
Basic Chart-Time Candle Visualization
// Create real-time candles for RSI
float rsi = ta.rsi(close, 14)
Candle rsi_candle = candle_series(rsi, CandleType.candlestick)
// Plot the candles using Pine's built-in function
plotcandle(rsi_candle.Open, rsi_candle.High, rsi_candle.Low, rsi_candle.Close,
"RSI Candles", rsi_candle.candle_color, rsi_candle.candle_color)
Multiple Access Patterns
The library provides three ways to access candle data, accommodating different programming styles:
// 1. Array-based access for collection operations
Candle candles = candle_array(source)
// 2. Object-oriented access for single entity manipulation
Candle candle = candle_series(source)
float value = candle.source(Source.HLC3)
// 3. Tuple-based access for functional programming styles
= candle_tuple(source)
Custom Timeframe Examples
// Create 20-second candles with EMA overlay
plot_ctf_candles(
source = close,
candle_type = CandleType.candlestick,
sample_type = SampleType.Time,
number_of_seconds = 20,
timezone = -5,
tied_open = true,
ema_period = 9,
enable_ema = true
)
// Create tick-based candles (new candle every 15 ticks)
plot_ctf_tick_candles(
source = close,
candle_type = CandleType.heikin_ashi,
number_of_ticks = 15,
timezone = -5,
tied_open = true
)
Advanced Usage with Custom Visualization
// Get custom timeframe candles without automatic plotting
CandleCTF my_candles = ctf_candles_array(
source = close,
candle_type = CandleType.candlestick,
sample_type = SampleType.Time,
number_of_seconds = 30
)
// Apply custom logic to the candles
float ema_values = my_candles.ctf_ema(14)
// Draw candles and EMA using time-based coordinates
my_candles.draw_ctf_candles_time()
ema_values.draw_ctf_line_time(line_color = #FF6D00)
Library Components
Data Types
Candle: Structure representing chart-time candles with OHLC, polarity, and visualization properties
CandleCTF: Extended candle structure with additional time metadata for custom timeframes
TickData: Structure for individual price updates with time deltas
Enumerations
CandleType: Specifies visualization style (candlestick or Heikin-Ashi)
Source: Defines price components for calculations (Open, High, Low, Close, HL2, etc.)
SampleType: Sets sampling method (Time-based or Tick-based)
Core Functions
get_tick(): Captures current price as a tick data point
candle_array(): Creates an array of candles from price updates
candle_series(): Provides a single candle based on latest data
candle_tuple(): Returns OHLC values as a tuple
ctf_candles_array(): Creates custom timeframe candles without rendering
Visualization Functions
source(): Extracts specific price components from candles
candle_ctf_to_float(): Converts candle data to float arrays
ctf_ema(): Calculates exponential moving averages for candle arrays
draw_ctf_candles_time(): Renders candles using time coordinates
draw_ctf_candles_index(): Renders candles using bar index coordinates
draw_ctf_line_time(): Renders lines using time coordinates
draw_ctf_line_index(): Renders lines using bar index coordinates
Technical Implementation Notes
This library leverages Pine Script's varip variables for state management, creating a sophisticated real-time data processing system. The implementation includes:
Efficient tick capturing: Samples price at every execution, maintaining temporal tracking with time deltas
Smart state management: Uses a hybrid approach with mutable updates at index 0 and historical preservation at index 1+
Temporal synchronization: Manages two time domains (chart time and custom timeframe)
The tooltip implementation provides crucial temporal context for custom timeframe visualizations, allowing users to understand exactly when each candle formed regardless of chart timeframe.
Limitations
Custom timeframe candles cannot be backtested due to Pine Script's limitations with historical tick data
Real-time visualization is only available during live chart updates
Maximum history is constrained by Pine Script's array size limits
Applications
Indicator visualization: See how RSI, MACD, or other indicators evolve in real-time
Volume analysis: Create custom volume profiles independent of chart timeframe
Scalping strategies: Identify short-term patterns with precisely defined time windows
Volatility measurement: Track price movement characteristics within bars
Custom signal generation: Create entry/exit signals based on custom timeframe patterns
Conclusion
The Real-Time Candles Library bridges the gap between traditional technical analysis (based on discrete OHLC bars) and the continuous nature of market movement. By making indicators more responsive to real-time price action, it gives traders a significant edge in timing and decision-making, particularly in fast-moving markets where waiting for bar close could mean missing important opportunities.
Whether you're building custom indicators, researching price patterns, or developing trading strategies, this library provides the foundation for sophisticated real-time analysis in Pine Script.
Implementation Details & Advanced Guide
Core Implementation Concepts
The Real-Time Candles Library implements a sophisticated event-driven architecture within Pine Script's constraints. At its heart, the library creates what's essentially a reactive programming framework handling continuous data streams.
Tick Processing System
The foundation of the library is the get_tick() function, which captures price updates as they occur:
export get_tick(series float source = close, series float na_replace = na)=>
varip float price = na
varip int series_index = -1
varip int old_time = 0
varip int new_time = na
varip float time_delta = 0
// ...
This function:
Samples the current price
Calculates time elapsed since last update
Maintains a sequential index to track updates
The resulting TickData structure serves as the fundamental building block for all candle generation.
State Management Architecture
The library employs a sophisticated state management system using varip variables, which persist across executions within the same bar. This creates a hybrid programming paradigm that's different from standard Pine Script's bar-by-bar model.
For chart-time candles, the core state transition logic is:
// Real-time update of current candle
candle_data := Candle.new(Open, High, Low, Close, polarity, series_index, candle_color)
candles.set(0, candle_data)
// When a new bar starts, preserve the previous candle
if clear_state
candles.insert(1, candle_data)
price.clear()
// Reset state for new candle
Open := Close
price.push(Open)
series_index += 1
This pattern of updating index 0 in real-time while inserting completed candles at index 1 creates an elegant solution for maintaining both current state and historical data.
Custom Timeframe Implementation
The custom timeframe system manages its own time boundaries independent of chart bars:
bool clear_state = switch settings.sample_type
SampleType.Ticks => cumulative_series_idx >= settings.number_of_ticks
SampleType.Time => cumulative_time_delta >= settings.number_of_seconds
This dual-clock system synchronizes two time domains:
Pine's execution clock (bar-by-bar processing)
The custom timeframe clock (tick or time-based)
The library carefully handles temporal discontinuities, ensuring candle formation remains accurate despite irregular tick arrival or market gaps.
Advanced Usage Techniques
1. Creating Custom Indicators with Real-Time Candles
To develop indicators that process real-time data within the current bar:
// Get real-time candles for your data
Candle rsi_candles = candle_array(ta.rsi(close, 14))
// Calculate indicator values based on candle properties
float signal = ta.ema(rsi_candles.first().source(Source.Close), 9)
// Detect patterns that occur within the bar
bool divergence = close > close and rsi_candles.first().Close < rsi_candles.get(1).Close
2. Working with Custom Timeframes and Plotting
For maximum flexibility when visualizing custom timeframe data:
// Create custom timeframe candles
CandleCTF volume_candles = ctf_candles_array(
source = volume,
candle_type = CandleType.candlestick,
sample_type = SampleType.Time,
number_of_seconds = 60
)
// Convert specific candle properties to float arrays
float volume_closes = volume_candles.candle_ctf_to_float(Source.Close)
// Calculate derived values
float volume_ema = volume_candles.ctf_ema(14)
// Create custom visualization
volume_candles.draw_ctf_candles_time()
volume_ema.draw_ctf_line_time(line_color = color.orange)
3. Creating Hybrid Timeframe Analysis
One powerful application is comparing indicators across multiple timeframes:
// Standard chart timeframe RSI
float chart_rsi = ta.rsi(close, 14)
// Custom 5-second timeframe RSI
CandleCTF ctf_candles = ctf_candles_array(
source = close,
candle_type = CandleType.candlestick,
sample_type = SampleType.Time,
number_of_seconds = 5
)
float fast_rsi_array = ctf_candles.candle_ctf_to_float(Source.Close)
float fast_rsi = fast_rsi_array.first()
// Generate signals based on divergence between timeframes
bool entry_signal = chart_rsi < 30 and fast_rsi > fast_rsi_array.get(1)
Final Notes
This library represents an advanced implementation of real-time data processing within Pine Script's constraints. By creating a reactive programming framework for handling continuous data streams, it enables sophisticated analysis typically only available in dedicated trading platforms.
The design principles employed—including state management, temporal processing, and object-oriented architecture—can serve as patterns for other advanced Pine Script development beyond this specific application.
------------------------
Library "real_time_candles"
A comprehensive library for creating real-time candles with customizable timeframes and sampling methods.
Supports both chart-time and custom-time candles with options for candlestick and Heikin-Ashi visualization.
Allows for tick-based or time-based sampling with moving average overlay capabilities.
get_tick(source, na_replace)
Captures the current price as a tick data point
Parameters:
source (float) : Optional - Price source to sample (defaults to close)
na_replace (float) : Optional - Value to use when source is na
Returns: TickData structure containing price, time since last update, and sequential index
candle_array(source, candle_type, sync_start, bullish_color, bearish_color)
Creates an array of candles based on price updates
Parameters:
source (float) : Optional - Price source to sample (defaults to close)
candle_type (simple CandleType) : Optional - Type of candle chart to create (candlestick or Heikin-Ashi)
sync_start (simple bool) : Optional - Whether to synchronize with the start of a new bar
bullish_color (color) : Optional - Color for bullish candles
bearish_color (color) : Optional - Color for bearish candles
Returns: Array of Candle objects ordered with most recent at index 0
candle_series(source, candle_type, wait_for_sync, bullish_color, bearish_color)
Provides a single candle based on the latest price data
Parameters:
source (float) : Optional - Price source to sample (defaults to close)
candle_type (simple CandleType) : Optional - Type of candle chart to create (candlestick or Heikin-Ashi)
wait_for_sync (simple bool) : Optional - Whether to wait for a new bar before starting
bullish_color (color) : Optional - Color for bullish candles
bearish_color (color) : Optional - Color for bearish candles
Returns: A single Candle object representing the current state
candle_tuple(source, candle_type, wait_for_sync, bullish_color, bearish_color)
Provides candle data as a tuple of OHLC values
Parameters:
source (float) : Optional - Price source to sample (defaults to close)
candle_type (simple CandleType) : Optional - Type of candle chart to create (candlestick or Heikin-Ashi)
wait_for_sync (simple bool) : Optional - Whether to wait for a new bar before starting
bullish_color (color) : Optional - Color for bullish candles
bearish_color (color) : Optional - Color for bearish candles
Returns: Tuple representing current candle values
method source(self, source, na_replace)
Extracts a specific price component from a Candle
Namespace types: Candle
Parameters:
self (Candle)
source (series Source) : Type of price data to extract (Open, High, Low, Close, or composite values)
na_replace (float) : Optional - Value to use when source value is na
Returns: The requested price value from the candle
method source(self, source)
Extracts a specific price component from a CandleCTF
Namespace types: CandleCTF
Parameters:
self (CandleCTF)
source (simple Source) : Type of price data to extract (Open, High, Low, Close, or composite values)
Returns: The requested price value from the candle as a varip
method candle_ctf_to_float(self, source)
Converts a specific price component from each CandleCTF to a float array
Namespace types: array
Parameters:
self (array)
source (simple Source) : Optional - Type of price data to extract (defaults to Close)
Returns: Array of float values extracted from the candles, ordered with most recent at index 0
method ctf_ema(self, ema_period)
Calculates an Exponential Moving Average for a CandleCTF array
Namespace types: array
Parameters:
self (array)
ema_period (simple float) : Period for the EMA calculation
Returns: Array of float values representing the EMA of the candle data, ordered with most recent at index 0
method draw_ctf_candles_time(self, sample_type, number_of_ticks, number_of_seconds, timezone)
Renders custom timeframe candles using bar time coordinates
Namespace types: array
Parameters:
self (array)
sample_type (simple SampleType) : Optional - Method for sampling data (Time or Ticks), used for tooltips
number_of_ticks (simple int) : Optional - Number of ticks per candle (used when sample_type is Ticks), used for tooltips
number_of_seconds (simple float) : Optional - Time duration per candle in seconds (used when sample_type is Time), used for tooltips
timezone (simple int) : Optional - Timezone offset from UTC (-12 to +12), used for tooltips
Returns: void - Renders candles on the chart using time-based x-coordinates
method draw_ctf_candles_index(self, sample_type, number_of_ticks, number_of_seconds, timezone)
Renders custom timeframe candles using bar index coordinates
Namespace types: array
Parameters:
self (array)
sample_type (simple SampleType) : Optional - Method for sampling data (Time or Ticks), used for tooltips
number_of_ticks (simple int) : Optional - Number of ticks per candle (used when sample_type is Ticks), used for tooltips
number_of_seconds (simple float) : Optional - Time duration per candle in seconds (used when sample_type is Time), used for tooltips
timezone (simple int) : Optional - Timezone offset from UTC (-12 to +12), used for tooltips
Returns: void - Renders candles on the chart using index-based x-coordinates
method draw_ctf_line_time(self, source, line_size, line_color)
Renders a line representing a price component from the candles using time coordinates
Namespace types: array
Parameters:
self (array)
source (simple Source) : Optional - Type of price data to extract (defaults to Close)
line_size (simple int) : Optional - Width of the line
line_color (simple color) : Optional - Color of the line
Returns: void - Renders a connected line on the chart using time-based x-coordinates
method draw_ctf_line_time(self, line_size, line_color)
Renders a line from a varip float array using time coordinates
Namespace types: array
Parameters:
self (array)
line_size (simple int) : Optional - Width of the line, defaults to 2
line_color (simple color) : Optional - Color of the line
Returns: void - Renders a connected line on the chart using time-based x-coordinates
method draw_ctf_line_index(self, source, line_size, line_color)
Renders a line representing a price component from the candles using index coordinates
Namespace types: array
Parameters:
self (array)
source (simple Source) : Optional - Type of price data to extract (defaults to Close)
line_size (simple int) : Optional - Width of the line
line_color (simple color) : Optional - Color of the line
Returns: void - Renders a connected line on the chart using index-based x-coordinates
method draw_ctf_line_index(self, line_size, line_color)
Renders a line from a varip float array using index coordinates
Namespace types: array
Parameters:
self (array)
line_size (simple int) : Optional - Width of the line, defaults to 2
line_color (simple color) : Optional - Color of the line
Returns: void - Renders a connected line on the chart using index-based x-coordinates
plot_ctf_tick_candles(source, candle_type, number_of_ticks, timezone, tied_open, ema_period, bullish_color, bearish_color, line_width, ema_color, use_time_indexing)
Plots tick-based candles with moving average
Parameters:
source (float) : Input price source to sample
candle_type (simple CandleType) : Type of candle chart to display
number_of_ticks (simple int) : Number of ticks per candle
timezone (simple int) : Timezone offset from UTC (-12 to +12)
tied_open (simple bool) : Whether to tie open price to close of previous candle
ema_period (simple float) : Period for the exponential moving average
bullish_color (color) : Optional - Color for bullish candles
bearish_color (color) : Optional - Color for bearish candles
line_width (simple int) : Optional - Width of the moving average line, defaults to 2
ema_color (color) : Optional - Color of the moving average line
use_time_indexing (simple bool) : Optional - When true the function will plot with xloc.time, when false it will plot using xloc.bar_index
Returns: void - Creates visual candle chart with EMA overlay
plot_ctf_tick_candles(source, candle_type, number_of_ticks, timezone, tied_open, bullish_color, bearish_color, use_time_indexing)
Plots tick-based candles without moving average
Parameters:
source (float) : Input price source to sample
candle_type (simple CandleType) : Type of candle chart to display
number_of_ticks (simple int) : Number of ticks per candle
timezone (simple int) : Timezone offset from UTC (-12 to +12)
tied_open (simple bool) : Whether to tie open price to close of previous candle
bullish_color (color) : Optional - Color for bullish candles
bearish_color (color) : Optional - Color for bearish candles
use_time_indexing (simple bool) : Optional - When true the function will plot with xloc.time, when false it will plot using xloc.bar_index
Returns: void - Creates visual candle chart without moving average
plot_ctf_time_candles(source, candle_type, number_of_seconds, timezone, tied_open, ema_period, bullish_color, bearish_color, line_width, ema_color, use_time_indexing)
Plots time-based candles with moving average
Parameters:
source (float) : Input price source to sample
candle_type (simple CandleType) : Type of candle chart to display
number_of_seconds (simple float) : Time duration per candle in seconds
timezone (simple int) : Timezone offset from UTC (-12 to +12)
tied_open (simple bool) : Whether to tie open price to close of previous candle
ema_period (simple float) : Period for the exponential moving average
bullish_color (color) : Optional - Color for bullish candles
bearish_color (color) : Optional - Color for bearish candles
line_width (simple int) : Optional - Width of the moving average line, defaults to 2
ema_color (color) : Optional - Color of the moving average line
use_time_indexing (simple bool) : Optional - When true the function will plot with xloc.time, when false it will plot using xloc.bar_index
Returns: void - Creates visual candle chart with EMA overlay
plot_ctf_time_candles(source, candle_type, number_of_seconds, timezone, tied_open, bullish_color, bearish_color, use_time_indexing)
Plots time-based candles without moving average
Parameters:
source (float) : Input price source to sample
candle_type (simple CandleType) : Type of candle chart to display
number_of_seconds (simple float) : Time duration per candle in seconds
timezone (simple int) : Timezone offset from UTC (-12 to +12)
tied_open (simple bool) : Whether to tie open price to close of previous candle
bullish_color (color) : Optional - Color for bullish candles
bearish_color (color) : Optional - Color for bearish candles
use_time_indexing (simple bool) : Optional - When true the function will plot with xloc.time, when false it will plot using xloc.bar_index
Returns: void - Creates visual candle chart without moving average
plot_ctf_candles(source, candle_type, sample_type, number_of_ticks, number_of_seconds, timezone, tied_open, ema_period, bullish_color, bearish_color, enable_ema, line_width, ema_color, use_time_indexing)
Unified function for plotting candles with comprehensive options
Parameters:
source (float) : Input price source to sample
candle_type (simple CandleType) : Optional - Type of candle chart to display
sample_type (simple SampleType) : Optional - Method for sampling data (Time or Ticks)
number_of_ticks (simple int) : Optional - Number of ticks per candle (used when sample_type is Ticks)
number_of_seconds (simple float) : Optional - Time duration per candle in seconds (used when sample_type is Time)
timezone (simple int) : Optional - Timezone offset from UTC (-12 to +12)
tied_open (simple bool) : Optional - Whether to tie open price to close of previous candle
ema_period (simple float) : Optional - Period for the exponential moving average
bullish_color (color) : Optional - Color for bullish candles
bearish_color (color) : Optional - Color for bearish candles
enable_ema (bool) : Optional - Whether to display the EMA overlay
line_width (simple int) : Optional - Width of the moving average line, defaults to 2
ema_color (color) : Optional - Color of the moving average line
use_time_indexing (simple bool) : Optional - When true the function will plot with xloc.time, when false it will plot using xloc.bar_index
Returns: void - Creates visual candle chart with optional EMA overlay
ctf_candles_array(source, candle_type, sample_type, number_of_ticks, number_of_seconds, tied_open, bullish_color, bearish_color)
Creates an array of custom timeframe candles without rendering them
Parameters:
source (float) : Input price source to sample
candle_type (simple CandleType) : Type of candle chart to create (candlestick or Heikin-Ashi)
sample_type (simple SampleType) : Method for sampling data (Time or Ticks)
number_of_ticks (simple int) : Optional - Number of ticks per candle (used when sample_type is Ticks)
number_of_seconds (simple float) : Optional - Time duration per candle in seconds (used when sample_type is Time)
tied_open (simple bool) : Optional - Whether to tie open price to close of previous candle
bullish_color (color) : Optional - Color for bullish candles
bearish_color (color) : Optional - Color for bearish candles
Returns: Array of CandleCTF objects ordered with most recent at index 0
Candle
Structure representing a complete candle with price data and display properties
Fields:
Open (series float) : Opening price of the candle
High (series float) : Highest price of the candle
Low (series float) : Lowest price of the candle
Close (series float) : Closing price of the candle
polarity (series bool) : Boolean indicating if candle is bullish (true) or bearish (false)
series_index (series int) : Sequential index identifying the candle in the series
candle_color (series color) : Color to use when rendering the candle
ready (series bool) : Boolean indicating if candle data is valid and ready for use
TickData
Structure for storing individual price updates
Fields:
price (series float) : The price value at this tick
time_delta (series float) : Time elapsed since the previous tick in milliseconds
series_index (series int) : Sequential index identifying this tick
CandleCTF
Structure representing a custom timeframe candle with additional time metadata
Fields:
Open (series float) : Opening price of the candle
High (series float) : Highest price of the candle
Low (series float) : Lowest price of the candle
Close (series float) : Closing price of the candle
polarity (series bool) : Boolean indicating if candle is bullish (true) or bearish (false)
series_index (series int) : Sequential index identifying the candle in the series
open_time (series int) : Timestamp marking when the candle was opened (in Unix time)
time_delta (series float) : Duration of the candle in milliseconds
candle_color (series color) : Color to use when rendering the candle

Cometreon_Public📚 Cometreon Public Library – Advanced Functions for Pine Script
This library contains advanced functions used in my public indicators on TradingView. The goal is to make the code more modular and efficient, allowing users to call pre-built functions for complex calculations without rewriting them from scratch.
🔹 Currently Available Functions:
1️⃣ Moving Average Function – Provides multiple types of moving averages to choose from, including:
SMA (Simple Moving Average)
EMA (Exponential Moving Average)
WMA (Weighted Moving Average)
RMA (Smoothed Moving Average)
HMA (Hull Moving Average)
JMA (Jurik Moving Average)
DEMA (Double Exponential Moving Average)
TEMA (Triple Exponential Moving Average)
LSMA (Least Squares Moving Average)
VWMA (Volume-Weighted Moving Average)
SMMA (Smoothed Moving Average)
KAMA (Kaufman’s Adaptive Moving Average)
ALMA (Arnaud Legoux Moving Average)
FRAMA (Fractal Adaptive Moving Average)
VIDYA (Variable Index Dynamic Average)
2️⃣ Custom RSI – Uses the Moving Average function to modify the calculation method, with an additional option for a dynamic version.
3️⃣ Custom MACD – Uses the Moving Average function to modify the calculation method, with an additional option for a dynamic version.
4️⃣ Custom Alligator – Uses the Moving Average function to modify generic calculations, allowing users to change the calculation method.

libTFLibrary "libTF"
libTF: Find higher/lower TF automatically
This library to find higher/lower TF from current timeframe(timeframe.period) for Pine Script version6(or higher).
Basic Algorithm
Using a timeframe scale Array and timeframe.in_seconds() function to find higher/lower timeframe.
Return value is na if could not find TF in the timeframe scale.
The timeframe scale could be changed by the parameter 'scale'(CSV).
How to use
1. Set higher/lower TF
higher()/lower() function returns higher/lower TF.
Default timeframe scale is "1, 5, 15, 60, 240, 1D, 1M, 3M, 12M".
example:
htf1 = higher()
htf2 = higher(htf1)
ltf1 = lower()
ltf2 = lower(ltf1)
2. Set higher/lower TF using your timeframe scale
The timeframe scale could be changed by the parameter.
example:
myscale="1,60,1D,1M,12M"
htf1 = higher(timeframe.period,myscale)
htf2 = higher(htf1,myscale)
ltf1 = lower(timeframe.period,myscale)
ltf2 = lower(ltf1,myscale)
3. How to use with request.*() function
na value is set if no higher/lower TF in timeframe scale.
It returns current timeframe's value, when na value as timeframe parameter in request.*().
As bellow, if it should be na when timeframe is na.
example:
return_value_request_htf1 = na(htf1)?na:request.security(syminfo.tickerid,htf1,timeframe.period)
return_value_request_ltf1 = na(ltf1)?na:request.security(syminfo.tickerid,ltf1,timeframe.period)
higher(tf, scale)
higher: find higher TF from TF string.
Parameters:
tf (string) : default value is timeframe.period.
scale (string) : TF scale in CSV. default is "1,5,15,60,240,1D,1W,1M,3M,12M".
Returns: higher TF string.
lower(tf, scale)
lower: find lower TF from TF string.
Parameters:
tf (string) : default value is timeframe.period.
scale (string) : TF scale in CSV. defalut is "1,5,15,60,240,1D,1W,1M,3M,12M".
Returns: lower TF string.

HTFCandlesLibLibrary "HTFCandlesLib"
Library to get detailed higher timeframe candle information
method tostring(this, delimeter)
Returns OHLC values, BarIndex of higher and lower timeframe candles in string format
Namespace types: Candle
Parameters:
this (Candle) : Current Candle object
delimeter (string) : delimeter to join the string components of the candle
Returns: String representation of the Candle
method draw(this, bullishColor, bearishColor, printDescription)
Draws the current candle using boxes and lines for body and wicks
Namespace types: Candle
Parameters:
this (Candle) : Current Candle object
bullishColor (color) : color for bullish representation
bearishColor (color) : color for bearish representation
printDescription (bool) : if set to true prints the description
Returns: Current candle object
getCurrentCandle(ltfCandles)
Gets the current candle along with reassigned ltf components. To be used with request.security to capture higher timeframe candle data
Parameters:
ltfCandles (array) : Lower timeframe Candles array
Returns: Candle object with embedded lower timeframe key candles in them
Candle
Candle represents the data related to a candle
Fields:
o (series float) : Open price of the candle
h (series float) : High price of the candle
l (series float) : Low price of the candle
c (series float) : Close price of the candle
lo (Candle) : Lower timeframe candle that records the open price of the current candle.
lh (Candle) : Lower timeframe candle that records the high price of the current candle.
ll (Candle) : Lower timeframe candle that records the low price of the current candle.
lc (Candle) : Lower timeframe candle that records the close price of the current candle.
barindex (series int) : Bar Index of the candle
bartime (series int) : Bar time of the candle
last (Candle) : Link to last candle of the series if any

TimeLibraryLibrary "TimeLibrary"
TODO: add library description here
Line_Type_Control(Type)
Line_Type_Control: This function changes between common line types options available are "Solid","Dashed","Dotted"
Parameters:
Type (string) : : The string to choose the line type from
Returns: Line_Type : returns the pine script equivalent of the string input
Text_Size_Switch(Text_Size)
Text_Size_Switch : This function changes between common text sizes options are "Normal", "Tiny", "Small", "Large", "Huge", "Auto"
Parameters:
Text_Size (string) : : The string to choose the text type from
Returns: Text_Type : returns the pine script equivalent of the string input
TF(TF_Period, TF_Multip)
TF generates a string representation of a time frame based on the provided time frame unit (`TF_Period`) and multiplier (`TF_Multip`).
Parameters:
TF_Period (simple string)
TF_Multip (simple int)
Returns: A string that represents the time frame in Pine Script format, depending on the `TF_Period`:
- For "Minute", it returns the multiplier as a string (e.g., "5" for 5 minutes).
- For "Hour", it returns the equivalent number of minutes (e.g., "120" for 2 hours).
- For "Day", it appends "D" to the multiplier (e.g., "2D" for 2 days).
- For "Week", it appends "W" to the multiplier (e.g., "1W" for 1 week).
- For "Month", it appends "M" to the multiplier (e.g., "3M" for 3 months).
If none of these cases match, it returns the current chart's time frame.
TF_Display(Chart_as_Timeframe, TF_Period, TF_Multip)
TF_Display generates a string representation of a time frame based on user-defined inputs or the current chart's time frame settings.
Parameters:
Chart_as_Timeframe (bool) : (bool): Determines whether to use the current chart's time frame or a custom time frame.
TF_Period` (string): The time frame unit (e.g., "Minute", "Hour", "Day", "Week", "Month").
TF_Multip` (int): The multiplier for the time frame (e.g., 15 for 15 minutes, 2 for 2 days).
TF_Period (string)
TF_Multip (int)
Returns: If `Chart_as_Timeframe` is `false`, the function returns a time frame string based on the provided `TF_Period` and `TF_Multip` values (e.g., "5Min", "2D").
If `Chart_as_Timeframe` is `true`, the function determines the current chart's time frame and returns it as a string:
For minute-based time frames, it returns the number of minutes with "Min" (e.g., "15Min") unless it's an exact hour, in which case it returns the hour (e.g., "1H").
For daily, weekly, and monthly time frames, it returns the multiplier with the appropriate unit (e.g., "1D" for daily, "1W" for weekly, "1M" for monthly).
MTF_MS_Display(Chart_as_Timeframe, TF_Period, TF_Multip, Swing_Length)
MTF_MS_Display This function calculates and returns a modified swing length value based on the selected time frame and current chart's time frame.
Parameters:
Chart_as_Timeframe (bool)
TF_Period (string)
TF_Multip (int)
Swing_Length (int)
HTF_Structure_Control(Chart_as_Timeframe, Show_Only_On_Lower_Timeframes, TF_Period, TF_Multip)
Parameters:
Chart_as_Timeframe (bool)
Show_Only_On_Lower_Timeframes (bool)
TF_Period (string)
TF_Multip (int)

TimeframeComparisonLibrary "TimeframeComparison"
Timeframe comparison for higher and lower timeframe
█ OVERVIEW
This library is used to compare higher / lower timeframe by using timeframe.multiplier.
minMult()
timeframe multiplier in minutes
Returns: float value

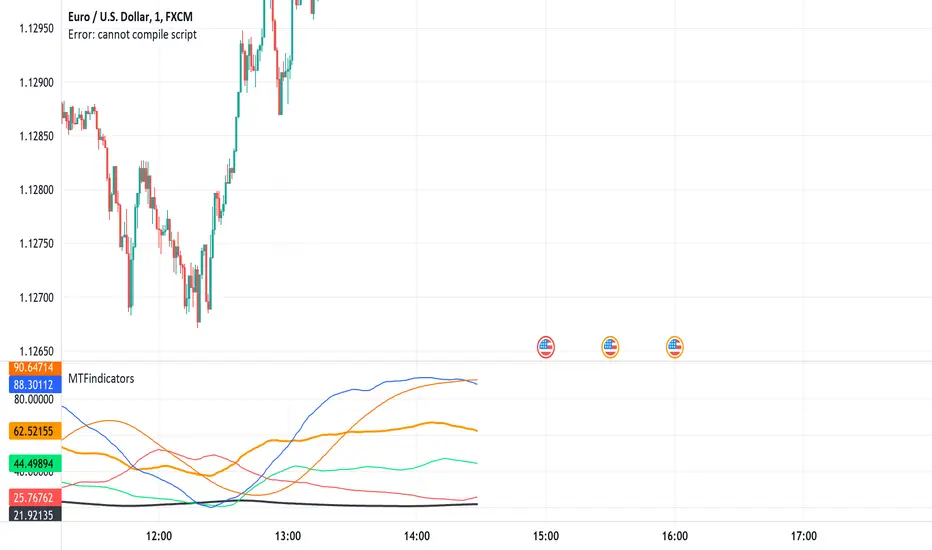
RSI MTF Panel [xdecow]This indicator shows the RSI of up to 10 different timeframes with various customization options:
Panel position
Panel orientation (vertical/horizontal)
Border width and color
Choose up to 10 time frames with RSI length and source
Background and text colors
Thresholds of overbought, oversold, uptrend, downtrend and no-trend zones to change the color of the RSI
Color debug mode

MTF_DrawingsLibrary 'MTF_Drawings'
This library helps with drawing indicators and candle charts on all timeframes.
FEATURES
CHART DRAWING : Library provides functions for drawing High Time Frame (HTF) and Low Time Frame (LTF) candles.
INDICATOR DRAWING : Library provides functions for drawing various types of HTF and LTF indicators.
CUSTOM COLOR DRAWING : Library allows to color candles and indicators based on specific conditions.
LINEFILLS : Library provides functions for drawing linefills.
CATEGORIES
The functions are named in a way that indicates they purpose:
{Ind} : Function is meant only for indicators.
{Hist} : Function is meant only for histograms.
{Candle} : Function is meant only for candles.
{Draw} : Function draws indicators, histograms and candle charts.
{Populate} : Function generates necessary arrays required by drawing functions.
{LTF} : Function is meant only for lower timeframes.
{HTF} : Function is meant only for higher timeframes.
{D} : Function draws indicators that are composed of two lines.
{CC} : Function draws custom colored indicators.
USAGE
Import the library into your script.
Before using any {Draw} function it is necessary to use a {Populate} function.
Choose the appropriate one based on the category, provide the necessary arguments, and then use the {Draw} function, forwarding the arrays generated by the {Populate} function.
This doesn't apply to {Draw_Lines}, {LineFill}, or {Barcolor} functions.
EXAMPLE
import Spacex_trader/MTF_Drawings/1 as tf
//Request lower timeframe data.
Security(simple string Ticker, simple string New_LTF, float Ind) =>
float Value = request.security_lower_tf(Ticker, New_LTF, Ind)
Value
Timeframe = input.timeframe('1', 'Timeframe: ')
tf.Draw_Ind(tf.Populate_LTF_Ind(Security(syminfo.tickerid, Timeframe, ta.rsi(close, 14)), 498, color.purple), 1, true)
FUNCTION LIST
HTF_Candle(BarsBack, BodyBear, BodyBull, BordersBear, BordersBull, WickBear, WickBull, LineStyle, BoxStyle, LineWidth, HTF_Open, HTF_High, HTF_Low, HTF_Close, HTF_Bar_Index)
Populates two arrays with drawing data of the HTF candles.
Parameters:
BarsBack (int) : Bars number to display.
BodyBear (color) : Candle body bear color.
BodyBull (color) : Candle body bull color.
BordersBear (color) : Candle border bear color.
BordersBull (color) : Candle border bull color.
WickBear (color) : Candle wick bear color.
WickBull (color) : Candle wick bull color.
LineStyle (string) : Wick style (Solid-Dotted-Dashed).
BoxStyle (string) : Border style (Solid-Dotted-Dashed).
LineWidth (int) : Wick width.
HTF_Open (float) : HTF open price.
HTF_High (float) : HTF high price.
HTF_Low (float) : HTF low price.
HTF_Close (float) : HTF close price.
HTF_Bar_Index (int) : HTF bar_index.
Returns: Two arrays with drawing data of the HTF candles.
LTF_Candle(BarsBack, BodyBear, BodyBull, BordersBear, BordersBull, WickBear, WickBull, LineStyle, BoxStyle, LineWidth, LTF_Open, LTF_High, LTF_Low, LTF_Close)
Populates two arrays with drawing data of the LTF candles.
Parameters:
BarsBack (int) : Bars number to display.
BodyBear (color) : Candle body bear color.
BodyBull (color) : Candle body bull color.
BordersBear (color) : Candle border bear color.
BordersBull (color) : Candle border bull color.
WickBear (color) : Candle wick bear color.
WickBull (color) : Candle wick bull color.
LineStyle (string) : Wick style (Solid-Dotted-Dashed).
BoxStyle (string) : Border style (Solid-Dotted-Dashed).
LineWidth (int) : Wick width.
LTF_Open (float ) : LTF open price.
LTF_High (float ) : LTF high price.
LTF_Low (float ) : LTF low price.
LTF_Close (float ) : LTF close price.
Returns: Two arrays with drawing data of the LTF candles.
Draw_Candle(Box, Line, Offset)
Draws HTF or LTF candles.
Parameters:
Box (box ) : Box array with drawing data.
Line (line ) : Line array with drawing data.
Offset (int) : Offset of the candles.
Returns: Drawing of the candles.
Populate_HTF_Ind(IndValue, BarsBack, IndColor, HTF_Bar_Index)
Populates one array with drawing data of the HTF indicator.
Parameters:
IndValue (float) : Indicator value.
BarsBack (int) : Indicator lines to display.
IndColor (color) : Indicator color.
HTF_Bar_Index (int) : HTF bar_index.
Returns: An array with drawing data of the HTF indicator.
Populate_LTF_Ind(IndValue, BarsBack, IndColor)
Populates one array with drawing data of the LTF indicator.
Parameters:
IndValue (float ) : Indicator value.
BarsBack (int) : Indicator lines to display.
IndColor (color) : Indicator color.
Returns: An array with drawing data of the LTF indicator.
Draw_Ind(Line, Mult, Exe)
Draws one HTF or LTF indicator.
Parameters:
Line (line ) : Line array with drawing data.
Mult (int) : Coordinates multiplier.
Exe (bool) : Display the indicator.
Returns: Drawing of the indicator.
Populate_HTF_Ind_D(IndValue_1, IndValue_2, BarsBack, IndColor_1, IndColor_2, HTF_Bar_Index)
Populates two arrays with drawing data of the HTF indicators.
Parameters:
IndValue_1 (float) : First indicator value.
IndValue_2 (float) : Second indicator value.
BarsBack (int) : Indicator lines to display.
IndColor_1 (color) : First indicator color.
IndColor_2 (color) : Second indicator color.
HTF_Bar_Index (int) : HTF bar_index.
Returns: Two arrays with drawing data of the HTF indicators.
Populate_LTF_Ind_D(IndValue_1, IndValue_2, BarsBack, IndColor_1, IndColor_2)
Populates two arrays with drawing data of the LTF indicators.
Parameters:
IndValue_1 (float ) : First indicator value.
IndValue_2 (float ) : Second indicator value.
BarsBack (int) : Indicator lines to display.
IndColor_1 (color) : First indicator color.
IndColor_2 (color) : Second indicator color.
Returns: Two arrays with drawing data of the LTF indicators.
Draw_Ind_D(Line_1, Line_2, Mult, Exe_1, Exe_2)
Draws two LTF or HTF indicators.
Parameters:
Line_1 (line ) : First line array with drawing data.
Line_2 (line ) : Second line array with drawing data.
Mult (int) : Coordinates multiplier.
Exe_1 (bool) : Display the first indicator.
Exe_2 (bool) : Display the second indicator.
Returns: Drawings of the indicators.
Barcolor(Box, Line, BarColor)
Colors the candles based on indicators output.
Parameters:
Box (box ) : Candle box array.
Line (line ) : Candle line array.
BarColor (color ) : Indicator color array.
Returns: Colored candles.
Populate_HTF_Ind_D_CC(IndValue_1, IndValue_2, BarsBack, BullColor, BearColor, IndColor_1, HTF_Bar_Index)
Populates two array with drawing data of the HTF indicators with color based on: IndValue_1 >= IndValue_2 ? BullColor : BearColor.
Parameters:
IndValue_1 (float) : First indicator value.
IndValue_2 (float) : Second indicator value.
BarsBack (int) : Indicator lines to display.
BullColor (color) : Bull color.
BearColor (color) : Bear color.
IndColor_1 (color) : First indicator color.
HTF_Bar_Index (int) : HTF bar_index.
Returns: Three arrays with drawing and color data of the HTF indicators.
Populate_LTF_Ind_D_CC(IndValue_1, IndValue_2, BarsBack, BullColor, BearColor, IndColor_1)
Populates two arrays with drawing data of the LTF indicators with color based on: IndValue_1 >= IndValue_2 ? BullColor : BearColor.
Parameters:
IndValue_1 (float ) : First indicator value.
IndValue_2 (float ) : Second indicator value.
BarsBack (int) : Indicator lines to display.
BullColor (color) : Bull color.
BearColor (color) : Bearcolor.
IndColor_1 (color) : First indicator color.
Returns: Three arrays with drawing and color data of the LTF indicators.
Populate_HTF_Hist_CC(HistValue, IndValue_1, IndValue_2, BarsBack, BullColor, BearColor, HTF_Bar_Index)
Populates one array with drawing data of the HTF histogram with color based on: IndValue_1 >= IndValue_2 ? BullColor : BearColor.
Parameters:
HistValue (float) : Indicator value.
IndValue_1 (float) : First indicator value.
IndValue_2 (float) : Second indicator value.
BarsBack (int) : Indicator lines to display.
BullColor (color) : Bull color.
BearColor (color) : Bearcolor.
HTF_Bar_Index (int) : HTF bar_index
Returns: Two arrays with drawing and color data of the HTF histogram.
Populate_LTF_Hist_CC(HistValue, IndValue_1, IndValue_2, BarsBack, BullColor, BearColor)
Populates one array with drawing data of the LTF histogram with color based on: IndValue_1 >= IndValue_2 ? BullColor : BearColor.
Parameters:
HistValue (float ) : Indicator value.
IndValue_1 (float ) : First indicator value.
IndValue_2 (float ) : Second indicator value.
BarsBack (int) : Indicator lines to display.
BullColor (color) : Bull color.
BearColor (color) : Bearcolor.
Returns: Two array with drawing and color data of the LTF histogram.
Populate_LTF_Hist_CC_VA(HistValue, Value, BarsBack, BullColor, BearColor)
Populates one array with drawing data of the LTF histogram with color based on: HistValue >= Value ? BullColor : BearColor.
Parameters:
HistValue (float ) : Indicator value.
Value (float) : First indicator value.
BarsBack (int) : Indicator lines to display.
BullColor (color) : Bull color.
BearColor (color) : Bearcolor.
Returns: Two array with drawing and color data of the LTF histogram.
Populate_HTF_Ind_CC(IndValue, IndValue_1, BarsBack, BullColor, BearColor, HTF_Bar_Index)
Populates one array with drawing data of the HTF indicator with color based on: IndValue >= IndValue_1 ? BullColor : BearColor.
Parameters:
IndValue (float) : Indicator value.
IndValue_1 (float) : Second indicator value.
BarsBack (int) : Indicator lines to display.
BullColor (color) : Bull color.
BearColor (color) : Bearcolor.
HTF_Bar_Index (int) : HTF bar_index
Returns: Two arrays with drawing and color data of the HTF indicator.
Populate_LTF_Ind_CC(IndValue, IndValue_1, BarsBack, BullColor, BearColor)
Populates one array with drawing data of the LTF indicator with color based on: IndValue >= IndValue_1 ? BullColor : BearColor.
Parameters:
IndValue (float ) : Indicator value.
IndValue_1 (float ) : Second indicator value.
BarsBack (int) : Indicator lines to display.
BullColor (color) : Bull color.
BearColor (color) : Bearcolor.
Returns: Two arrays with drawing and color data of the LTF indicator.
Draw_Lines(BarsBack, y1, y2, LineType, Fill)
Draws price lines on indicators.
Parameters:
BarsBack (int) : Indicator lines to display.
y1 (float) : Coordinates of the first line.
y2 (float) : Coordinates of the second line.
LineType (string) : Line type.
Fill (color) : Fill color.
Returns: Drawing of the lines.
LineFill(Upper, Lower, BarsBack, FillColor)
Fills two lines with linefill HTF or LTF.
Parameters:
Upper (line ) : Upper line.
Lower (line ) : Lower line.
BarsBack (int) : Indicator lines to display.
FillColor (color) : Fill color.
Returns: Linefill of the lines.
Populate_LTF_Hist(HistValue, BarsBack, HistColor)
Populates one array with drawing data of the LTF histogram.
Parameters:
HistValue (float ) : Indicator value.
BarsBack (int) : Indicator lines to display.
HistColor (color) : Indicator color.
Returns: One array with drawing data of the LTF histogram.
Populate_HTF_Hist(HistValue, BarsBack, HistColor, HTF_Bar_Index)
Populates one array with drawing data of the HTF histogram.
Parameters:
HistValue (float) : Indicator value.
BarsBack (int) : Indicator lines to display.
HistColor (color) : Indicator color.
HTF_Bar_Index (int) : HTF bar_index.
Returns: One array with drawing data of the HTF histogram.
Draw_Hist(Box, Mult, Exe)
Draws HTF or LTF histogram.
Parameters:
Box (box ) : Box Array.
Mult (int) : Coordinates multiplier.
Exe (bool) : Display the histogram.
Returns: Drawing of the histogram.

libHTF[without request.security()]Library "libHTF"
libHTF: use HTF values without request.security()
This library enables to use HTF candles without request.security().
Basic data structure
Using to access values in the same manner as series variable.
The last member of HTF array is always latest current TF's data.
If new bar in HTF(same as last bar closes), new member is pushed to HTF array.
2nd from the last member of HTF array is latest fixed(closed) bar.
HTF: How to use
1. set TF
tf_higher() function selects higher TF. TF steps are ("1","5","15","60","240","D","W","M","3M","6M","Y").
example:
tfChart = timeframe.period
htf1 = tf_higher(tfChart)
2. set HTF matrix
htf_candle() function returns 1 bool and 1 matrix.
bool is a flag for start of new candle in HTF context.
matrix is HTF candle data(0:open,1:time_open,2:close,3:time_close,4:high,5:time:high,6:low,7:time_low).
example:
=htf_candle(htf1)
3. how to access HTF candle data
you can get values using .lastx() method.
please be careful, return value is always float evenif it is "time". you need to cast to int time value when using for xloc.bartime.
example:
htf1open=m1.lastx("open")
htf1close=m1.lastx("close")
//if you need to use histrical value.
lastopen=open
lasthtf1open=m1.lastx("open",1)
4. how to store Data of HTF context
you have to use array to store data of HTF context.
array.htf_push() method handles the last member of array. if new_bar in HTF, it push new member. otherwise it set value to the last member.
example:
array a_close=array.new(1,na)
a_close.htf_push(b_new_bar1,m1.lastx("close"))
HTFsrc: How to use
1. how to setup src.
set_src() function is set current tf's src from string(open/high/low/close/hl2/hlc3/ohlc4/hlcc4).
set_htfsrc() function returns src array of HTF candle.
example:
_src="ohlc4"
src=set_src(_src)
htf1src=set_htfsrc(_src,b_new_bar1,m1)
(if you need to use HTF src in series float)
s_htf1src=htf1src.lastx()
HighLow: How to use
1. set HTF arrays
highlow() and htfhighlow() function calculates high/low and return high/low prices and time.
the functions return 1 int and 8arrays.
int is a flag for new high(1) or new low(-1).
arrays are high/low and return high/low data. float for price, int for time.
example
=
highlow()
=
htfhighlow(m1)
2. how to access HighLow data
you can get values using .lastx() method.
example:
if i_renew==1
myhigh=a_high.lastx()
//if you need to use histrical value.
myhigh=a_high.lastx(1)
other functions
functions for HTF candle matrix or HTF src array in this script are
htf_sma()/htf_ema()/htf_rma()
htf_rsi()/htf_rci()/htf_dmi()
method lastx(arrayid, lastindex)
method like array.last. it returns lastindex from the last member, if parameter is set.
Namespace types: float
Parameters:
arrayid (float )
lastindex (int) : (int) default value is "0"(the last member). if you need to access historical value, increment it(same manner as series vars).
Returns: float value of lastindex from the last member of the array. returns na, if fail.
method lastx(arrayid, lastindex)
method like array.last. it returns lastindex from the last member, if parameter is set.
Namespace types: int
Parameters:
arrayid (int )
lastindex (int) : (int) default value is "0"(the last member). if you need to access historical value, increment it(same manner as series vars).
Returns: int value of lastindex from the last member of the array. returns na, if fail.
method lastx(m, _type, lastindex)
method for handling htf matrix.
Namespace types: matrix
Parameters:
m (matrix) : (matrix) matrix for htf candle.
_type (string) : (string) value type of htf candle:
lastindex (int) : (int) default value is "0"(the last member).
Returns: (float) value of htf candle. (caution: need to cast float to int to use time values!)
method set_last(arrayid, val)
method to set a value of the last member of the array. it sets value to the last member.
Namespace types: float
Parameters:
arrayid (float )
val (float) : (float) value to set.
Returns: nothing
method htf_push(arrayid, b, val)
method to push new member to htf context. if new bar in htf, it works as push. else it works as set_last.
Namespace types: float
Parameters:
arrayid (float )
b (bool) : (bool) true:push,false:set_last
val (float) : (float) _f the value to set.
Returns: nothing
method tf_higher(tf)
method to set higher tf from tf string. TF steps are .
Namespace types: series string, simple string, input string, const string
Parameters:
tf (string) : (string) tf string
Returns: (string) string of higher tf.
htf_candle(_tf, _TZ)
build htf candles
Parameters:
_tf (string) : (string) tf string.
_TZ (string) : of timezone. default value is "GMT+3".
Returns: bool for new bar@htf and matrix for snapshot of htf candle
set_src(_src_type)
set src.
Parameters:
_src_type (string) : (string) type of source:
Returns: (series float) src value
set_htfsrc(_src_type, _nb, _m)
set htf src.
Parameters:
_src_type (string) : (string) type of source:
_nb (bool) : (bool) flag of new bar
_m (matrix) : (matrix) matrix for htf candle.
Returns: (array) array of src value
is_up()
last_is_up()
peak_bottom(_latest, _last)
Parameters:
_latest (bool)
_last (bool)
htf_is_up(_m)
Parameters:
_m (matrix)
htf_last_is_up(_m)
Parameters:
_m (matrix)
highlow(_b_bartime_price)
Parameters:
_b_bartime_price (bool)
htfhighlow(_m, _b_bartime_price)
Parameters:
_m (matrix)
_b_bartime_price (bool)
htf_sma(_a_src, _len)
Parameters:
_a_src (float )
_len (int)
htf_rma(_a_src, _new_bar, _len)
Parameters:
_a_src (float )
_new_bar (bool)
_len (int)
htf_ema(_a_src, _new_bar, _len)
Parameters:
_a_src (float )
_new_bar (bool)
_len (int)
htf_rsi(_a_src, _new_bar, _len)
Parameters:
_a_src (float )
_new_bar (bool)
_len (int)
rci(_src, _len)
Parameters:
_src (float)
_len (int)
htf_rci(_a_src, _len)
Parameters:
_a_src (float )
_len (int)
htf_dmi(_m, _new_bar, _len, _ma_type)
Parameters:
_m (matrix)
_new_bar (bool)
_len (int)
_ma_type (string)

lower_tf█ OVERVIEW
This library is a Pine programmer’s tool containing functions to help those who use the request.security_lower_tf() function. Its `ltf()` function helps translate user inputs into a lower timeframe string usable with request.security_lower_tf() . Another function, `ltfStats()`, accumulates statistics on processed chart bars and intrabars.
█ CONCEPTS
Chart bars
Chart bars , as referred to in our publications, are bars that occur at the current chart timeframe, as opposed to those that occur at a timeframe that is higher or lower than that of the chart view.
Intrabars
Intrabars are chart bars at a lower timeframe than the chart's. Each 1H chart bar of a 24x7 market will, for example, usually contain 60 intrabars at the LTF of 1min, provided there was market activity during each minute of the hour. Mining information from intrabars can be useful in that it offers traders visibility on the activity inside a chart bar.
Lower timeframes (LTFs)
A lower timeframe is a timeframe that is smaller than the chart's timeframe. This framework exemplifies how authors can determine which LTF to use by examining the chart's timeframe. The LTF determines how many intrabars are examined for each chart bar; the lower the timeframe, the more intrabars are analyzed.
Intrabar precision
The precision of calculations increases with the number of intrabars analyzed for each chart bar. As there is a 100K limit to the number of intrabars that can be analyzed by a script, a trade-off occurs between the number of intrabars analyzed per chart bar and the chart bars for which calculations are possible.
█ `ltf()`
This function returns a timeframe string usable with request.security_lower_tf() . It calculates the returned timeframe by taking into account a user selection between eight different calculation modes and the chart's timeframe. You send it the user's selection, along with the text corresponding to the eight choices from which the user has chosen, and the function returns a corresponding LTF string.
Because the function processes strings and doesn't require recalculation on each bar, using var to declare the variable to which its result is assigned will execute the function only once on bar zero and speed up your script:
var string ltfString = ltf(ltfModeInput, LTF1, LTF2, LTF3, LTF4, LTF5, LTF6, LTF7, LTF8)
The eight choices users can select from are of two types: the first four allow a selection from the desired amount of chart bars to be covered, the last four are choices of a fixed number of intrabars to be analyzed per chart bar. Our example code shows how to structure your input call and then make the call to `ltf()`. By changing the text associated with the `LTF1` to `LTF8` constants, you can tailor it to your preferences while preserving the functionality of `ltf()` because you will be sending those string constants as the function's arguments so it can determine the user's selection. The association between each `LTFx` constant and its calculation mode is fixed, so the order of the arguments is important when you call `ltf()`.
These are the first four modes and the `LTFx` constants corresponding to each:
Covering most chart bars (least precise) — LTF1
Covers all chart bars. This is accomplished by dividing the current timeframe in seconds by 4 and converting that number back to a string in timeframe.period format using secondsToTfString() . Due to the fact that, on premium subscriptions, the typical historical bar count is between 20-25k bars, dividing the timeframe by 4 ensures the highest level of intrabar precision possible while achieving complete coverage for the entire dataset with the maximum allowed 100K intrabars.
Covering some chart bars (less precise) — LTF2
Covering less chart bars (more precise) — LTF3
These levels offer a stepped LTF in relation to the chart timeframe with slightly more, or slightly less precision. The stepped lower timeframe tiers are calculated from the chart timeframe as follows:
Chart Timeframe Lower Timeframe
Less Precise More Precise
< 1hr 1min 1min
< 1D 15min 1min
< 1W 2hr 30min
> 1W 1D 60min
Covering the least chart bars (most precise) — LTF4
Analyzes the maximum quantity of intrabars possible by using the 1min LTF, which also allows the least amount of chart bars to be covered.
The last four modes allow the user to specify a fixed number of intrabars to analyze per chart bar. Users can choose from 12, 24, 50 or 100 intrabars, respectively corresponding to the `LTF5`, `LTF6`, `LTF7` and `LTF8` constants. The value is a target; the function will do its best to come up with a LTF producing the required number of intrabars. Because of considerations such as the length of a ticker's session, rounding of the LTF to the closest allowable timeframe, or the lowest allowable timeframe of 1min intrabars, it is often impossible for the function to find a LTF producing the exact number of intrabars. Requesting 100 intrabars on a 60min chart, for example, can only produce 60 1min intrabars. Higher chart timeframes, tickers with high liquidity or 24x7 markets will produce optimal results.
█ `ltfStats()`
`ltfStats()` returns statistics that will be useful to programmers using intrabar inspection. By analyzing the arrays returned by request.security_lower_tf() in can determine:
• intrabarsInChartBar : The number of intrabars analyzed for each chart bar.
• chartBarsCovered : The number of chart bars where intrabar information is available.
• avgIntrabars : The average number of intrabars analyzed per chart bar. Events like holidays, market activity, or reduced hours sessions can cause the number of intrabars to vary, bar to bar.
The function must be called on each bar to produce reliable results.
█ DEMONSTRATION CODE
Our example code shows how to provide users with an input from which they can select a LTF calculation mode. If you use this library's functions, feel free to reuse our input setup code, including the tooltip providing users with explanations on how it works for them.
We make a simple call to request.security_lower_tf() to fetch the close values of intrabars, but we do not use those values. We simply send the returned array to `ltfStats()` and then plot in the indicator's pane the number of intrabars examined on each bar and its average. We also display an information box showing the user's selection of the LTF calculation mode, the resulting LTF calculated by `ltf()` and some statistics.
█ NOTES
• As in several of our recent publications, this script uses secondsToTfString() to produce a timeframe string in timeframe.period format from a timeframe expressed in seconds.
• The script utilizes display.data_window and display.status_line to restrict the display of certain plots.
These new built-ins allow coders to fine-tune where a script’s plot values are displayed.
• We implement a new recommended best practice for tables which works faster and reduces memory consumption.
Using this new method, tables are declared only once with var , as usual. Then, on bar zero only, we use table.cell() calls to populate the table.
Finally, table.set_*() functions are used to update attributes of table cells on the last bar of the dataset.
This greatly reduces the resources required to render tables. We encourage all Pine Script™ programmers to do the same.
Look first. Then leap.
█ FUNCTIONS
The library contains the following functions:
ltf(userSelection, choice1, choice2, choice3, choice4, choice5, choice6, choice7, choice8)
Selects a LTF from the chart's TF, depending on the `userSelection` input string.
Parameters:
userSelection : (simple string) User-selected input string which must be one of the `choicex` arguments.
choice1 : (simple string) Input selection corresponding to "Least precise, covering most chart bars".
choice2 : (simple string) Input selection corresponding to "Less precise, covering some chart bars".
choice3 : (simple string) Input selection corresponding to "More precise, covering less chart bars".
choice4 : (simple string) Input selection corresponding to "Most precise, 1min intrabars".
choice5 : (simple string) Input selection corresponding to "~12 intrabars per chart bar".
choice6 : (simple string) Input selection corresponding to "~24 intrabars per chart bar".
choice7 : (simple string) Input selection corresponding to "~50 intrabars per chart bar".
choice8 : (simple string) Input selection corresponding to "~100 intrabars per chart bar".
Returns: (simple string) A timeframe string to be used with `request.security_lower_tf()`.
ltfStats()
Returns statistics about analyzed intrabars and chart bars covered by calls to `request.security_lower_tf()`.
Parameters:
intrabarValues : (float [ ]) The ID of a float array containing values fetched by a call to `request.security_lower_tf()`.
Returns: A 3-element tuple: [ (series int) intrabarsInChartBar, (series int) chartBarsCovered, (series float) avgIntrabars ].

drawcandlesLibrary "drawcandles"
simple utility to draw different candles using box and lines. Quite useful for drawing candles such as zigzag candles or MTF candles
draw(o, h, l, c, oBar, cBar)
draws candles based on ohlc values
Parameters:
o : Open Price
h : High Price
l : Low Price
c : Close Price
oBar : Open Time
cBar : Close Time
Returns: void
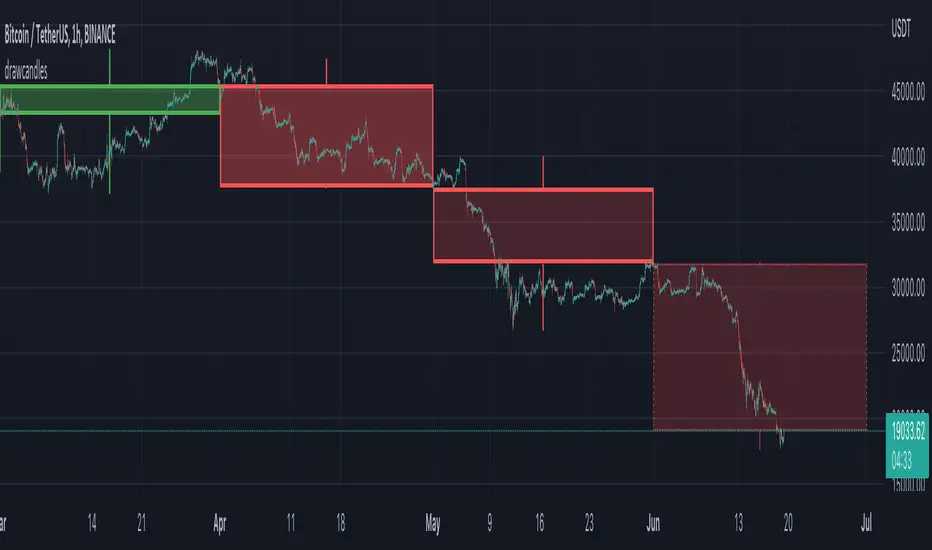
Custom Multi-Timeframe IndicatorIt's a pretty simple example of a nice custom screener you can run for multiple timeframes. This is an RSI screener, but you can easily change the function for your own Indicator.
Screener displays:
Last value of the instrument
RSI value for up to 10 instruments / 4 timeframes.
In Parameters you can change:
4 timeframes
10 instruments
Parameters for RSI
Styling parameters for table
If the selected timeframe will be lower than the current one you will receive a warning message in a table.
Thanks to @MUQWISHI to help me code it.
Disclaimer
Please remember that past performance may not be indicative of future results.
Due to various factors, including changing market conditions, the strategy may no longer perform as well as in historical backtesting.
This post and the script don’t provide any financial advice.

HighTimeframeSamplingLibrary "HighTimeframeSampling"
Library for sampling high timeframe (HTF) data. Returns an array of historical values, an arbitrary historical value, or the highest/lowest value in a range, spending a single security() call.
An optional pass-through for the chart timeframe is included. Other than that case, the data is fixed and does not alter over the course of the HTF bar. It behaves consistently on historical and elapsed realtime bars.
The first version returns floating-point numbers only. I might extend it if there's interest.
🙏 Credits: This library is (yet another) attempt at a solution of the problems in using HTF data that were laid out by Pinecoders - to whom, especially to Luc F, many thanks are due - in "security() revisited" - which I recommend you consult first. Go ahead, I'll wait.
All code is my own.
~~~~~~~~~~~~~~~~~~~~~~~~~~~~~~~~~~~~~~~~~~~~~~~~~~~~~~~~~~~~~~~~~~~~
WHAT'S THE PROBLEM? OR, WHY NOT JUST USE SECURITY()
~~~~~~~~~~~~~~~~~~~~~~~~~~~~~~~~~~~~~~~~~~~~~~~~~~~~~~~~~~~~~~~~~~~~
There are many difficulties with using HTF data, and many potential solutions. It's not really possible to convey it only in words: you need to see it on a chart.
Before using this library, please refer to my other HTF library, HighTimeframeTiming: which explains it extensively, compares many different solutions, and demonstrates (what I think are) the advantages of using this very library, namely, that it's stable, accurate, versatile and inexpensive. Then if you agree, come back here and choose your function.
~~~~~~~~~~~~~~~~~~~~~~~~~~~~~~~~~~~~~~~~~~~~~~~~~~~~~~~~~~~~~~~~~~~~
MOAR EXPLANATION
~~~~~~~~~~~~~~~~~~~~~~~~~~~~~~~~~~~~~~~~~~~~~~~~~~~~~~~~~~~~~~~~~~~~
🧹 Housekeeping: To see which plot is which, turn line labels on: Settings > Scales > Indicator Name Label. Vertical lines at the top of the chart show the open of a HTF bar: grey for historical and white for real-time bars.
‼ LIMITATIONS: To avoid strange behaviour, use this library on liquid assets and at chart timeframes high enough to reliably produce updates at least once per bar period.
A more conventional and universal limitation is that the library does not offer an unlimited view of historical bars. You need to define upfront how many HTF bars you want to store. Very large numbers might conceivably run into data or performance issues.
~~~~~~~~~~~~~~~~~~~~~~~~~~~~~~~~~~~~~~~~~~~~~~~~~~~~~~~~~~~~~~~~~~~~
BRING ON THE FUNCTIONS
~~~~~~~~~~~~~~~~~~~~~~~~~~~~~~~~~~~~~~~~~~~~~~~~~~~~~~~~~~~~~~~~~~~~
@function f_HTF_Value(string _HTF, float _source, int _arrayLength, int _HTF_Offset, bool _useLiveDataOnChartTF=false)
Returns a floating-point number from a higher timeframe, with a historical operator within an abitrary (but limited) number of bars.
@param string _HTF is the string that represents the higher timeframe. It must be in a format that the request.security() function recognises. The input timeframe cannot be lower than the chart timeframe or an error is thrown.
@param float _source is the source value that you want to sample, e.g. close, open, etc., or you can use any floating-point number.
@param int _arrayLength is the number of HTF bars you want to store and must be greater than zero. You can't go back further in history than this number of bars (minus one, because the current/most recent available bar is also stored).
@param int _HTF_Offset is the historical operator for the value you want to return. E.g., if you want the most recent fixed close, _source=close and _HTF_Offset = 0. If you want the one before that, _HTF_Offset=1, etc.
The number of HTF bars to look back must be zero or more, and must be one less than the number of bars stored.
@param bool _useLiveDataOnChartTF uses live data on the chart timeframe.
If the higher timeframe is the same as the chart timeframe, store the live value (i.e., from this very bar). For all truly higher timeframes, store the fixed value (i.e., from the previous bar).
The default is to use live data for the chart timeframe, so that this function works intuitively, that is, it does not fix data unless it has to (i.e., because the data is from a higher timeframe).
This means that on default settings, on the chart timeframe, it matches the raw source values from security(){0}.
You can override this behaviour by passing _useLiveDataOnChartTF as false. Then it will fix all data for all timeframes.
@returns a floating-point value that you requested from the higher timeframe.
@function f_HTF_Array(string _HTF, float _source, int _arrayLength, bool _useLiveDataOnChartTF=false, int _startIn, int _endIn)
Returns an array of historical values from a higher timeframe, starting with the current bar. Optionally, returns a slice of the array. The array is in reverse chronological order, i.e., index 0 contains the most recent value.
@param string _HTF is the string that represents the higher timeframe. It must be in a format that the request.security() function recognises. The input timeframe cannot be lower than the chart timeframe or an error is thrown.
@param float _source is the source value that you want to sample, e.g. close, open, etc., or you can use any floating-point number.
@param int _arrayLength is the number of HTF bars you want to keep in the array.
@param bool _useLiveDataOnChartTF uses live data on the chart timeframe.
If the higher timeframe is the same as the chart timeframe, store the live value (i.e., from this very bar). For all truly higher timeframes, store the fixed value (i.e., from the previous bar).
The default is to use live data for the chart timeframe, so that this function works intuitively, that is, it does not fix data unless it has to (i.e., because the data is from a higher timeframe).
This means that on default settings, on the chart timeframe, it matches raw source values from security().
You can override this behaviour by passing _useLiveDataOnChartTF as false. Then it will fix all data for all timeframes.
@param int _startIn is the array index to begin taking a slice. Must be at least one less than the length of the array; if out of bounds it is corrected to 0.
@param int _endIn is the array index BEFORE WHICH to end the slice. If the ending index of the array slice would take the slice past the end of the array, it is corrected to the end of the array. The ending index of the array slice must be greater than or equal to the starting index. If the end is less than the start, the whole array is returned. If the starting index is the same as the ending index, an empty array is returned. If either the starting or ending index is negative, the entire array is returned (which is the default behaviour; this is effectively a switch to bypass the slicing without taking up an extra parameter).
@returns an array of HTF values.
@function f_HTF_Highest(string _HTF="", float _source, int _arrayLength, bool _useLiveDataOnChartTF=true, int _rangeIn)
Returns the highest value within a range consisting of a given number of bars back from the most recent bar.
@param string _HTF is the string that represents the higher timeframe. It must be in a format that the request.security() function recognises. The input timeframe cannot be lower than the chart timeframe or an error is thrown.
@param float _source is the source value that you want to sample, e.g. close, open, etc., or you can use any floating-point number.
@param int _arrayLength is the number of HTF bars you want to store and must be greater than zero. You can't have a range greater than this number.
@param bool _useLiveDataOnChartTF uses live data on the chart timeframe.
If the higher timeframe is the same as the chart timeframe, store the live value (i.e., from this very bar). For all truly higher timeframes, store the fixed value (i.e., from the previous bar).
The default is to use live data for the chart timeframe, so that this function works intuitively, that is, it does not fix data unless it has to (i.e., because the data is from a higher timeframe).
This means that on default settings, on the chart timeframe, it matches raw source values from security().
You can override this behaviour by passing _useLiveDataOnChartTF as false. Then it will fix all data for all timeframes.
@param _rangeIn is the number of bars to include in the range of bars from which we want to find the highest value. It is NOT the historical operator of the last bar in the range. The range always starts at the current bar. A value of 1 doesn't make much sense but the function will generously return the only value it can anyway. A value less than 1 doesn't make sense and will return an error. A value that is higher than the number of stored values will be corrected to equal the number of stored values.
@returns a floating-point number representing the highest value in the range.
@function f_HTF_Lowest(string _HTF="", float _source, int _arrayLength, bool _useLiveDataOnChartTF=true, int _rangeIn)
Returns the lowest value within a range consisting of a given number of bars back from the most recent bar.
@param string _HTF is the string that represents the higher timeframe. It must be in a format that the request.security() function recognises. The input timeframe cannot be lower than the chart timeframe or an error is thrown.
@param float _source is the source value that you want to sample, e.g. close, open, etc., or you can use any floating-point number.
@param int _arrayLength is the number of HTF bars you want to store and must be greater than zero. You can't go back further in history than this number of bars (minus one, because the current/most recent available bar is also stored).
@param bool _useLiveDataOnChartTF uses live data on the chart timeframe.
If the higher timeframe is the same as the chart timeframe, store the live value (i.e., from this very bar). For all truly higher timeframes, store the fixed value (i.e., from the previous bar).
The default is to use live data for the chart timeframe, so that this function works intuitively, that is, it does not fix data unless it has to (i.e., because the data is from a higher timeframe).
This means that on default settings, on the chart timeframe, it matches raw source values from security().
You can override this behaviour by passing _useLiveDataOnChartTF as false. Then it will fix all data for all timeframes.
@param _rangeIn is the number of bars to include in the range of bars from which we want to find the highest value. It is NOT the historical operator of the last bar in the range. The range always starts at the current bar. A value of 1 doesn't make much sense but the function will generously return the only value it can anyway. A value less than 1 doesn't make sense and will return an error. A value that is higher than the number of stored values will be corrected to equal the number of stored values.
@returns a floating-point number representing the lowest value in the range.
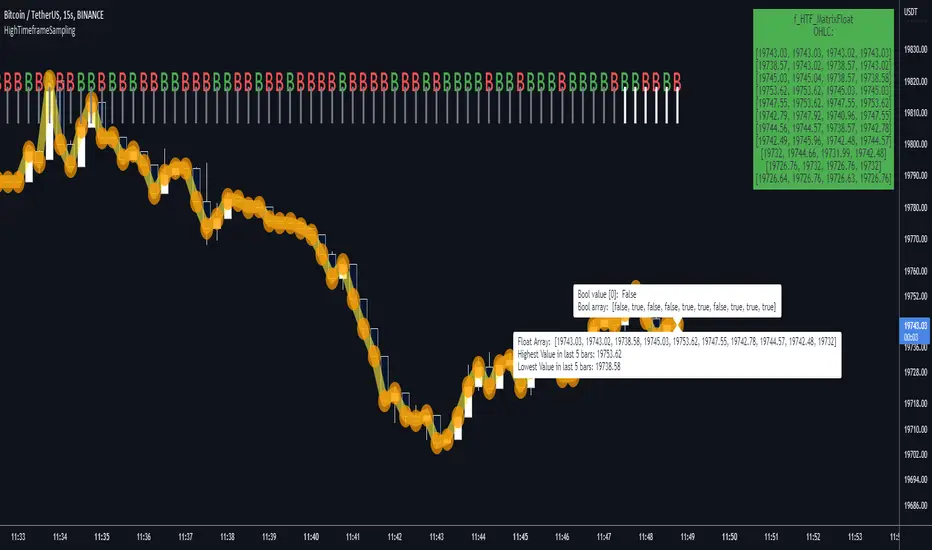
MTF Ichimoku Analysis[tanayroy]Ichimoku can state market conditions better than any indicator or group of indicators(My own perspective). Ichimoku works seamlessly in different timeframes. Analysis of Ichimoku in different timeframes can give you the bigger picture of the market.
This indicator analyzes six different timeframes with Ichimoku in depth. Default timeframes are 5M, 30M, 60M, D, W, and M. You can change the default timeframes from the setting.
As we are dealing with many relations, we can define the relationship with a simple score to get the trend strength.
Ichimoku Analysis:
Relationship of Price(P) with Ichimoku indicators: Here we are analyzing the current price and Ichimoku indicators. The position of price with respect to Ichimoku indicators states the market condition clearly.
Price(P) and Kumo(C): P > C = Bullish (↑). P < C = Bearish (↓). P <> C = consolidation or no trend(↔). Score: ±2
Price(P) and Tenkan Sen(T): P >= T = Bullish (↑). P < T = Bearish (↓). Score: ±0.5
Price(P) and Kijun Sen(K): P >= K = Bullish (↑). P < T = Bearish (↓). Score: ±0.5
Price(26 bars ago) and Chiku(L): L >= P(26) = Bullish (↑). L < P(26) = Bearish (↓). Score: ±0.5
Tenkan Sen and Kijun Sen Relation. Tenkan Sen depicts short-term trends and Kijun depicts mid-term trends. So this relationship is important for analyzing the current trend of the market.
Tenkan Sen(T) and Kijun Sen(K): T >= K = Bullish (↑). T < K = Bearish (↓). Score: ±2
Direction of Ichimoku indicators.
The direction of Ichimoku indicators helps us to understand the trend strength.
Tenkan Sen's(T) direction: Upward slope = Bullish (↑). Downward slope = Bearish (↓). Flat=consolidation or no trend(↔). Score: ±0.5
Kijun Sen's(K) direction: Upward slope = Bullish (↑). Downward slope = Bearish (↓). Flat=consolidation or no trend(↔). Score: ±0.5
Senkou A(A) direction: Upward slope = Bullish (↑). Downward slope = Bearish (↓). Flat=consolidation or no trend(↔). Score: ±0.5
Senkou B(A) direction: Upward slope = Bullish (↑). Downward slope = Bearish (↓). Flat=consolidation or no trend(↔). Score: ±0.5
Cloud and other Ichimoku indicators:
Kumo or Cloud is very important in the Ichimoku system. Analyzing its relation with other indicators is important to detect the overall market condition.
Kumo(C) and Tenkan Sen(T): T >= C = Bullish (↑). T < C = Bearish (↓). T <> C = consolidation or no trend(↔). Score: ±0.5
Kumo(C) and Kijun Sen(K): K >= C = Bullish (↑). K < C = Bearish (↓). K <> C = consolidation or no trend(↔). Score: ±0.5
Kumo(C) and Chiku(L): L >= C = Bullish (↑). L < C = Bearish (↓). L <> C = consolidation or no trend(↔). Score: ±0.5
Kumo(C) Shadow: By analyzing the last 252 bars(you can change this option) we are analyzing the Kumo shadow behind the current price. If Kumo shadow is present behind the price, trend strength will be weakened. Score: ±0.5
Kumo(C) Future (Senkou A(A) and Senkou B(B)): A >= B = Bullish (↑). A < B = Bearish (↓). Score: ±0.5
Chiku(L) Analysis:
Vertical and Horizontal Chiku analysis will tell us about the possible consolidation of the price.
Chiku Vertical: if the price consolidates for the next 5 bars(You can change this option) will it run into the price. Please remember we are placing the current price 26 bars ago and we are interested to see the current price in open space for a clear trend. Score: ±0.5
Chikou Horizontal: If Chiku is in open space (Not running into the price), we want to review Chiku vertically i.e how much percentage of fall or rise of the current price can cause Chiku to run into the price.
So, the maximum trend score is ±10.5.
Ichimoku signals:
We know, that the crossover of Ichimoku indicators provides important signals. In this section, you can see all the crossover i.e when they happened (Bars ago)
Distance between price and Tenkan Sen and Kijun Sen: We know, the price come back to Tenkan/Kijun if it goes far away from Tenkan/Kijun. So it is important to note the distance between Tenkan and Price.
Please note that this indicator is not a strategy or buy/sell signal. It just shows you the picture of Ichimoku in multiple timeframes. I am working on some strategies of Ichimoku and will publish the same when my research is complete.
If you want to analyze Ichimoku in a single timeframe, please review the following indicator.
To maintain the table size you can use the shorthand notation from the setting.
Table with detailed analysis:
Table with shorthand notation:
Please comment if you want any clarification or found any bugs to report.

SuperJump QQE MOD MTFThis is a QQE MOD MTF version.
Mihkel00 modified Glaz's script, I modified Mihkel00 's script again.
This is a QQE Mod original version by Mihkel00 :
I simply changed the above script to update pine script 5.0 and extracted two functions.
Thank you to the two authors for sharing such a great script.

bytimeLibrary "bytime"
TODO: to do something at the specified time.
////Return =>> ht = hour , mt = minute , st = second ,Dt = Day, Mt = month, Yt = year , dateTime = full time format./////////////
Note : Remember to always add import when you call our library and change Gtime() to Timeset.Gtime() is used to access internal data.
import hapharmonic/bytime/1 as Timeset
=Timeset.Gtime()
/////////////Set a time to trigger an alert./////////////
ck = false
///hour : minute : second
if ht == TH and mt == TM and st == TS
//some action
//...
//.
ck := true
Gtime()
Pivots libraryLibrary "Pivots"
TODO: add library description here
pivots(_type, _open, _high, _low, _clsoe) Calculates the pivot point and returns its value.
Parameters:
_type : Specifies the type of pivot point.
_open : The open price
_high : The high price
_low : The low price
_clsoe : The close price
Returns: Returns the value of the calculated pivot point as a tuple.
cpr(_high, _low, _clsoe) Calculate the Central Pivot Range
Parameters:
_high : The high price
_low : The low price
_clsoe : The close price
Returns: Returns the values as a tuple.
htf_ohlc(_htf) Calculate the HTF values
Parameters:
_htf : Resolution
Returns: Returns the values as a tuple.
MTF RSI + Average (Multi-Timeframe) [TH]Multi-Timeframe Relative Strength Index --- MTF RSI
Eliminates having to change time intervals to view a different Time Interval's RSI value (up to 5 time intervals possible through the settings).
The RSI values from Multiple Time Frames can be averaged together to show one single RSI.
A table overlay (info box) makes it easy to quickly identify RSI values on the multiple different time frames.

Last Available Bar InfoLibrary "Last_Available_Bar_Info"
getLastBarTimeStamp()
getAvailableBars()
This simple library is built with an aim of getting the last available bar information for the chart. This returns a constant value that doesn't change on bar change.
For backtesting with accurate results on non standard charts, it will be helpful. (Especially if you are using non standard charts like Renko Chart).
Methods
getLastBarTimeStamp()
: Returns Timestamp of the last available bar (Constant)
getAvailableBars()
:Returns Number of Available Bars on the chart (Constant)
Example
import paragjyoti2012/Last_Available_Bar_Info/v1 as LastBarInfo
last_bar_timestamp=LastBarInfo.getLastBarTimeStamp()
no_of_bars=LastBarInfo.getAvailableBars()
If you are using Renko Charts, for backtesting, it's necesary to filter out the historical bars that are not of this timeframe.
In Renko charts, once the available bars of the current timeframe (based on your Tradingview active plan) are exhausted,
previous bars are filled in with historical bars of higher timeframe. Which is detrimental for backtesting, and it leads to unrealistic results.
To get the actual number of bars available of that timeframe, you should use this security function to get the timestamp for the last (real) bar available.
tf=timeframe.period
real_available_bars = request.security(syminfo.ticker, tf , LastBarInfo.getAvailableBars() , lookahead = barmerge.lookahead_off)
last_available_bar_timestamp = request.security(syminfo.ticker, tf , LastBarInfo.getLastBarTimeStamp() , lookahead = barmerge.lookahead_off)
MTFindicatorsQuite recently TradingView added the possibility to create and use Libraries in PineScript. With this feature PineScript became higher quality of coding language overnight. Libraries enable splitting your code into multiple files, providing easier access to code reusability.
I was working on a script which included 3000 lines of code, which was recompiling 1:30 min, and recalculating over 1 minute as well. So I split it into 2 parts: main part + library containing "main logic", which I reuse in variety of scripts, but don't change too often. Result? Now recompilation of my main script takes 10 and recalculation 8 seconds!!!. I instantly fell in love with libraries.
Having said that, and being dedicated hater of security() calls, I have decided to publish a library of MTF indicators created with my own approach: "dig into formula". I have explained reasons for such approach in desription to this script:
So this library script will be a set of indicators reaching to higher timeframes. Just include one line at the beginning of the script you are creating:
import Peter_O/MTFindicators/1 as LIB
and then somewhere is the code add this line:
rsimtf=LIB.rsi_mtf(close,5,14)
All of a sudden you have access to rsimtf from 5x higher timeframe without any hassle :)
I start with RSI MTF, next ones will be ADX, Stochastic and some more. I will update this library with them here as well. Feel free to request particular indicators in comments. Maybe PSAR? Maybe Bollinger Bands?