OPEN-SOURCE SCRIPT
已更新 TICK Grid (TheMas7er)
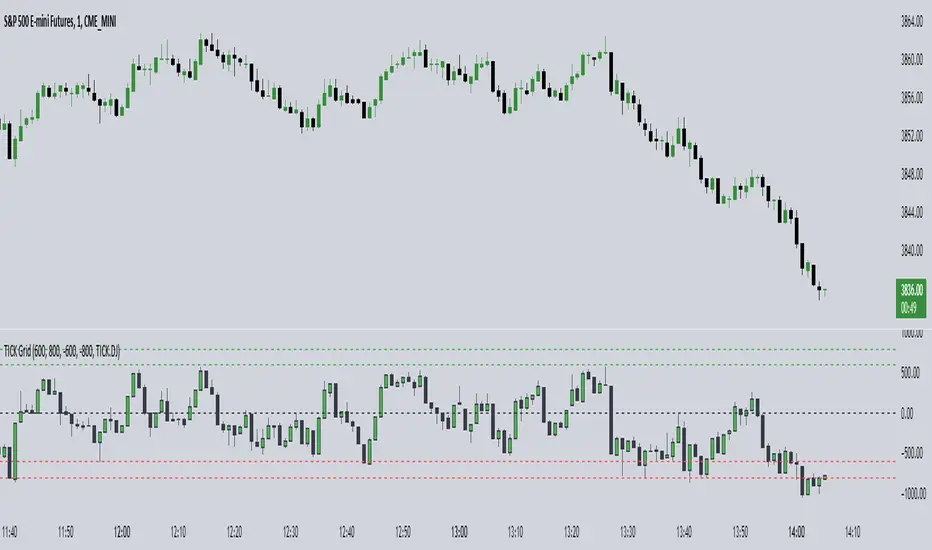
█ OVERVIEW
Shows the NYSE Tick Index, as it is used by TheMas7er.
This indicator has several customization options built-in that can be configured:
• Positive and negative threshold levels with show/hide option and color selection.
• Zero line with show/hide option and color selection.
• Bar colors are fully customizable.
• Symbol can be changed. Default is USI:TICK for the New York Stock Exchange.
Tick Indices are available in TradingView as a symbol - just like any other stock - which you can show on a chart.
This script adds a pane with your selected Tick Index, which can then be used as an indicator to make short-term trading decisions.
█ CONCEPTS
The Tick Index is a short-term barometer of internal market strength.
It shows the number of stocks trading on an uptick minus the number of stocks trading on a downtick, and is used by day traders to view the overall market sentiment at a given point in time.
It's categorized as a Breadth Indicator because it analyzes the "Breadth and Scope" of an entire Index.
Since the Tick Index measures the up/down ticks of a universe of stocks, any collection of stocks (market,index,...) could theoretically have it's own Tick Index.
Some of the major Tick Indices are:
• USI:TICK for the New York Stock Exchange
• USI:TICKQ for Nasdaq
• USI:TICKI for the Down Jones
發行說明
Bugfix: up/down candle colors were inverted.發行說明
Updated chart to reflect correction of up/down candle colors that were inverted.發行說明
Updated chart to show the 1 minute timeframe.發行說明
Bugfix: Ticker was hard-coded, and didn't change with the input selection.h/t to mojotv1 who was the first to notice and report this obvious mistake.
開源腳本
本著TradingView的真正精神,此腳本的創建者將其開源,以便交易者可以查看和驗證其功能。向作者致敬!雖然您可以免費使用它,但請記住,重新發佈程式碼必須遵守我們的網站規則。
免責聲明
這些資訊和出版物並不意味著也不構成TradingView提供或認可的金融、投資、交易或其他類型的意見或建議。請在使用條款閱讀更多資訊。
開源腳本
本著TradingView的真正精神,此腳本的創建者將其開源,以便交易者可以查看和驗證其功能。向作者致敬!雖然您可以免費使用它,但請記住,重新發佈程式碼必須遵守我們的網站規則。
免責聲明
這些資訊和出版物並不意味著也不構成TradingView提供或認可的金融、投資、交易或其他類型的意見或建議。請在使用條款閱讀更多資訊。